Next-Gen App & Browser
Testing Cloud
Trusted by 2 Mn+ QAs & Devs to accelerate their release cycles

- Testing Basis
- Home
- /
- Learning Hub
- /
- Finance Statistics
- -
- March 21 2023
Finance Statistics 101: A Comprehensive List
Get insights into financial trends and performance with our comprehensive finance statistics. Analyze data, make informed decisions, and drive success.
Total Chapters (2)
Chapter 2 : Finance Statistics
- Share:
OVERVIEW
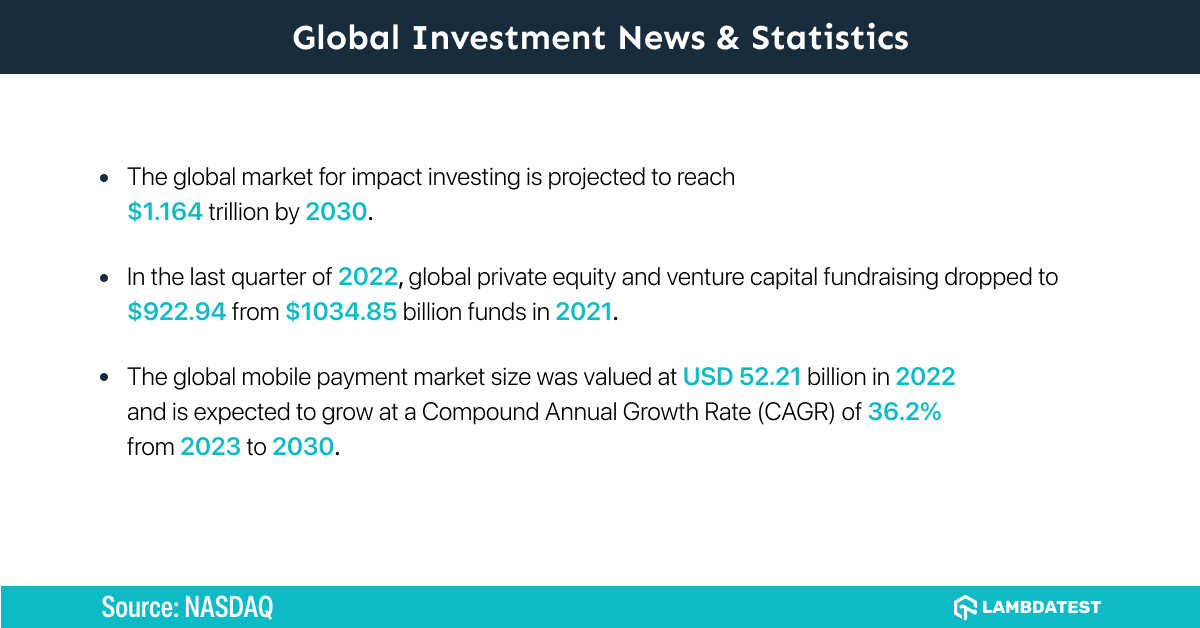
The global market for impact investing is projected to reach $1.164 trillion by 2030.
The collection, analysis, and interpretation of financial data are the focus of the branch of mathematics known as finance statistics. The performance of financial parameters like stocks, bonds, and derivatives and economic indicators like inflation, interest rates, and GDP are evaluated using statistical techniques and tools (GDP).
In recent years, the significance of financial statistics has increased along with the complexity and interconnectedness of the world economy. To make educated decisions about investments, risk management, and financial planning, financial institutions, businesses, and investors rely on financial statistics. By examining historical data and identifying trends and patterns, financial statistics can provide insight into how financial markets operate and help with future projections.
Financial Market
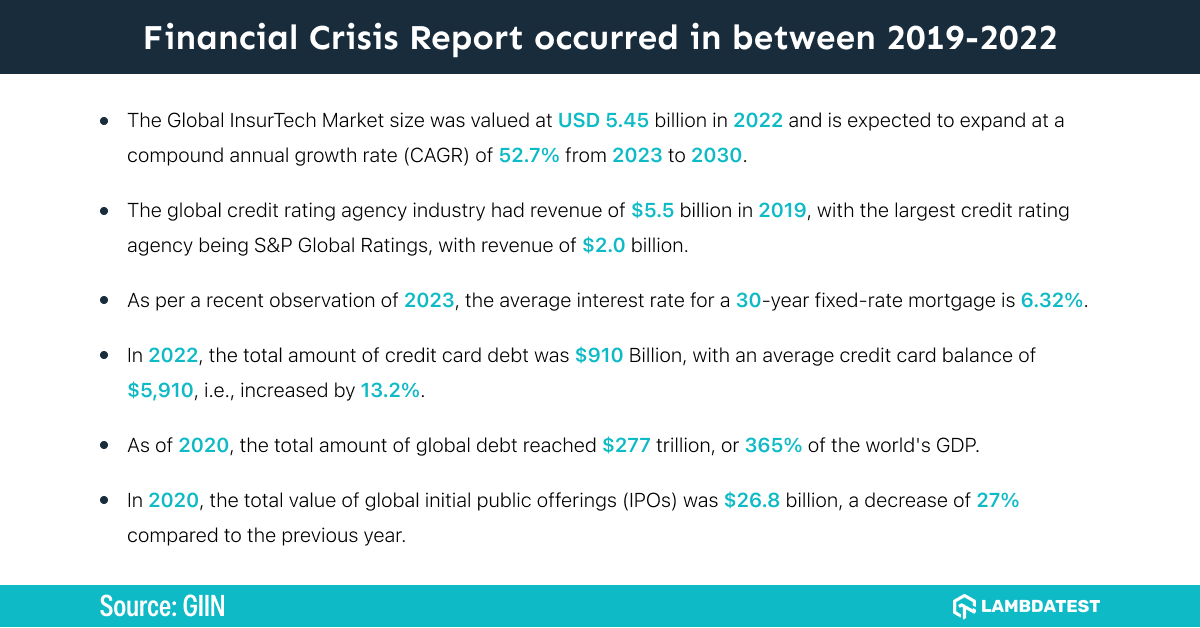
- As of 2020, the total amount of global debt reached $277 trillion, or 365% of the world's GDP. (Source: Institute of International Finance)
- In 2022, the total amount of credit card debt was $910 Billion, with an average credit card balance of $5,910, i.e., increased by 13.2%. (Source: Experian)
- In the U.S., the total mortgage debt increased to $11.2 Trillion in 2022, with an average mortgage balance of $236,443. (Source: Experian)
- As per a recent observation of 2023, the average interest rate for a 30-year fixed-rate mortgage is 6.32%. (Source: FRED, Federal Reserve Bank of St. Louis)
- The Dow Jones Industrial Average (DJIA) reached an all-time high of 33,715.37 in 2022. (Source: CNBC)
- The global foreign exchange market has daily trading reached $7.5 trillion in 2022, up 14% from $6.6 trillion three years earlier. (Source: Bank for International Settlements)
- As of 2022, Apple, Saudi Aramco, and Microsoft hold the top three positions, each with market caps over $2 trillion. (Source: Investopedia)
- In 2021, the global robo-advisory industry had assets under management (AUM) of over $1.4 trillion. (Source: Statista)
- As of 2021, the top 10 largest banks in the world by total assets were: Industrial and Commercial Bank of China, China Construction Bank, Agricultural Bank of China, Bank of China, JPMorgan Chase & Co., Mitsubishi UFJ Financial Group, Bank of America, HSBC Holdings plc, BNP Paribas, and Credit Agricole. (Source: Statista)
- Financial technology (fintech) market size was estimated at $110.59 billion globally in 2020 and is projected to grow at a CAGR of 20.5% to reach $699.50 billion by 2030. (Source: GlobeNewswire)
- The size of the global insurtech market was estimated at USD 5.45 billion in 2022 and is anticipated to grow at a CAGR of 52.7% from 2023 to 2030. (Source: Grand View Research)
- According to the latest reports, the global trade finance market was valued at $8.4 trillion in 2022, and it is projected to reach $11 trillion by 2029, growing at a compound annual growth rate (CAGR) of 5.4% during the forecast period 2023-2029. (Source: PR Newswire)
- In 2020, the total value of global initial public offerings (IPOs) was $26.8 billion, a decrease of 27% compared to the previous year. (Source: Angel One)
- In 2020, the global peer-to-peer lending market size was valued at $67.9 billion, and it is projected to reach $558.9 billion by 2027, growing at a compound annual growth rate (CAGR) of 29.7% during the forecast period. (Source: Allied Market Research)
- The total value of global foreign exchange (forex) trading was $6.6 trillion per day in 2020, with the United Kingdom accounting for the largest share of daily forex trading volume. (Source: Bank for International Settlements)
- As of 2021, the global crowdfunding market size was valued at $13.9 billion, and it is projected to reach $28.8 billion by 2027, growing at a compound annual growth rate (CAGR) of 10.6% during the forecast period. (Source: Grand View Research)
- The global credit rating agency industry had revenue of $5.5 billion in 2019, with the largest credit rating agency being S&P Global Ratings, with revenue of $2.0 billion. (Source: IBISWorld)
- The global financial technology market is anticipated to expand steadily over the forecast period of 2022–2027, expanding at a compound annual rate of about 25.18% to reach a market value of about $324 billion by 2026. (Source: Market Data Forecast)
- The global mergers and acquisitions (M&A) market had a total deal value of $3.6 trillion in 2020, with the largest M&A deal being the acquisition of ARM Holdings by Nvidia Corporation for $40 billion. (Source: Statista)
- According to the estimates released in November 2019 by BEA, personal income increased by $101.7 billion. (Bureau of Economic Analysis)
- A report from the global banking trade claims that in 2022, the nominal value of global debt decreased by $4 trillion, narrowly bringing it back under the $300 trillion mark that it had crossed in 2021. (World Economic Forum)
Investment Analysis
- JPMorgan was the leading investment bank globally as of December 2022 regarding the market share of the revenue. JPMorgan generated revenue of roughly 1.73 billion U.S. dollars in the first quarter of 2022. (Source: Statista)
- In the last quarter of 2022, global private equity and venture capital fundraising dropped to $922.94 from $1034.85 billion funds in 2021. (Source: S&P Global Market Intelligence)
- In 2021, the global assets under management (AUM) of the exchange-traded funds (ETFs) industry surpassed $9 trillion. (Source: ETFGI)
- In 2021, the global market capitalization of cryptocurrencies reached an all-time high of over $2.7 trillion. (Source: CoinMarketCap)
- The global mobile payment market size was valued at USD 52.21 billion in 2022 and is expected to grow at a Compound Annual Growth Rate (CAGR) of 36.2% from 2023 to 2030. (Source: Grand View Research)
- As of 2021, the total value of global sustainable investing assets was $35.3 trillion, representing 36% of all professionally managed assets worldwide. (Source: Global Sustainable Investment Alliance)
In 2020, the total value of global venture capital investments was $300 billion,a decrease of 6.7% compared to the previous year.
Risk Management
- The total consumer debt balance increased to $16.38 trillion in 2022, up from $15.31 trillion in 2021. (Source: Federal Reserve Bank of New York)
- The tech-heavy Nasdaq Composite Index reached an all-time high of 16,057.44 in 2021, gaining 0.4% due to strong performance by large-cap technology stocks. While in intraday trading, the index recorded a fresh all-time high of 16,121.12. (Source: Nasdaq)
- The New York Stock Exchange is the largest in the world, with an equity market capitalization of nearly 23 trillion U.S. dollars as of December 2022. The following three exchanges were the NASDAQ, the Shanghai Stock Exchange, and Euronext. (Source: Statista)
- The total student loan debt in the United States in 2022 is $1.74 trillion dollars. That’s higher than the total GDP of Canada ($1.65 trillion), Russia ($1.578 trillion), or Australia ($1.323 trillion). (Source: FinMasters)
- The global wealth management industry had assets under management (AUM) of $129 trillion in 2020, with the largest wealth manager being UBS, with an AUM of $3.1 trillion. (Source: UBS)
- The REIT market is estimated to grow at a CAGR of 2.8% between 2022 and 2027. The size of the market is forecast to increase by USD 333.01 billion. (Source: REIT)
- As of 2021, the global insurance industry had premiums written of $6.2 trillion, with the largest insurance company being UnitedHealth Group, with premiums of $254.6 billion. (Source: Insurance Information Institute)
- In 2020, the global impact of COVID-19 on the banking industry was significant, with banks setting aside over $1.2 trillion for loan losses and facing declining profitability due to lower interest rates and reduced economic activity. (Source: McKinsey & Company)
Financial Modeling
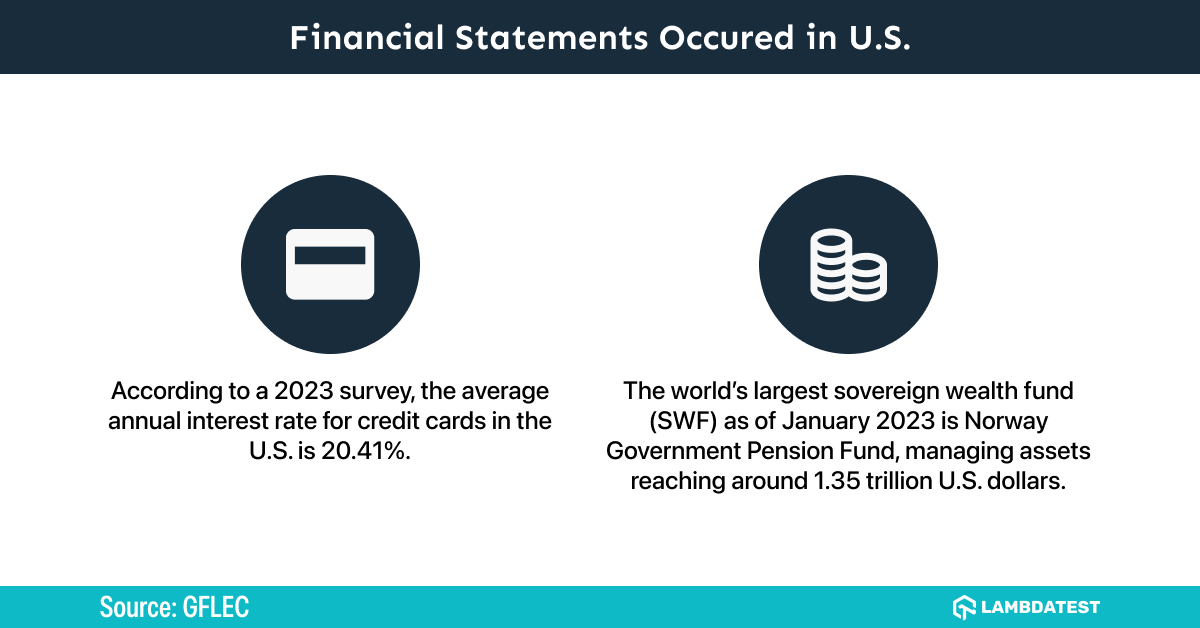
According to CreditCard.com survey in 2023, the average annual interest rate for credit cards in the U.S. is 20.41%.
- The world's largest sovereign wealth fund (SWF) as of January 2023 is Norway Government Pension Fund, managing assets reaching around 1.35 trillion U.S. dollars. (Source: Sovereign Wealth Fund Institute)
- The size of the global software asset management market is anticipated to increase at a compound annual growth rate (CAGR) of 18.1% over the course of the forecast period, from $2 billion in 2021 to $4.8 billion in 2026. (Source: MarketsandMarkets)
- As of 2021, the United States had the highest number of billionaires in the world, with 724 individuals having a net worth of $4.4 trillion or more. China is at second with 698 people. (Source: Forbes)
- The total value of global mergers and acquisitions (M&A) activity was $2.2 trillion in 2020, compared to $2.4 trillion in 2019. (Source: EY)
- The global asset servicing market will grow from $1159.45 billion in 2022 to $1277.82 billion in 2023 at a compound annual growth rate (CAGR) of 10.2%. The asset servicing market is expected to grow to $1830.69 billion in 2027 at a CAGR of 9.4%. (Source: GlobeNewswire)
- The global artificial intelligence market size was valued at USD 136.55 billion in 2022 and is projected to expand at a compound annual growth rate (CAGR) of 37.3% from 2023 to 2030. (Source: Grand View Research)
- The global crowdfunding market size was valued at $17.2 billion in 2020, and it is projected to reach $34.6 billion by 2026, growing at a compound annual growth rate (CAGR) of 17% during the forecast period between 2021 and 2026. (Source: Market Data Forecast)
- The global banking as a service (BaaS) market size was valued at $19.65 billion in 2021, and it is projected to reach $31.4 billion by 2030, growing at a compound annual growth rate (CAGR) of 16.2% during the forecast period. (Source: Grand View Research)
- In 2021, the global neobank market was valued at $45 billion, growing at a CAGR of 45% during the forecast period from 2022 to 2028. (Source: Global Market Insights)
- The global wealth management platform market is projected to grow from USD 2.64 billion in 2022 to USD 6.29 billion by 2029, exhibiting a CAGR of 13.2% during the forecast period. (Source: Fortune Business Insights)
Explore the latest trends and insightful 90+ statistics of insurance industry. From data driven insights to industry updates , discover the future of insurance industry today!
Econometrics
- The median income for U.S. households in 2020 was $67,521, a decrease of 2.9 percent from the 2019 median of $69,560. (Source: U.S. Census Bureau)
- The official poverty rate in 2020 was 11.4 percent, an approximately a 1% increase from 2019. There were 37.2 million people in poverty in 2020, approximately 3.3 million more compared to 2019. (Source: U.S. Census Bureau)
- Total US federal government debt breached the $30 trillion mark for the first time in history in February 2022. As of February 2023, the total federal debt is $31.5 trillion, of which $24.6 trillion is held by the public and $6.9 trillion in intragovernmental debt. (Source: U.S. Department of the Treasury)
- As per recent data from 2023, the average annual salary for a financial analyst in the U.S. is $95,570. (Source: U.S. Bureau of Labor Statistics)
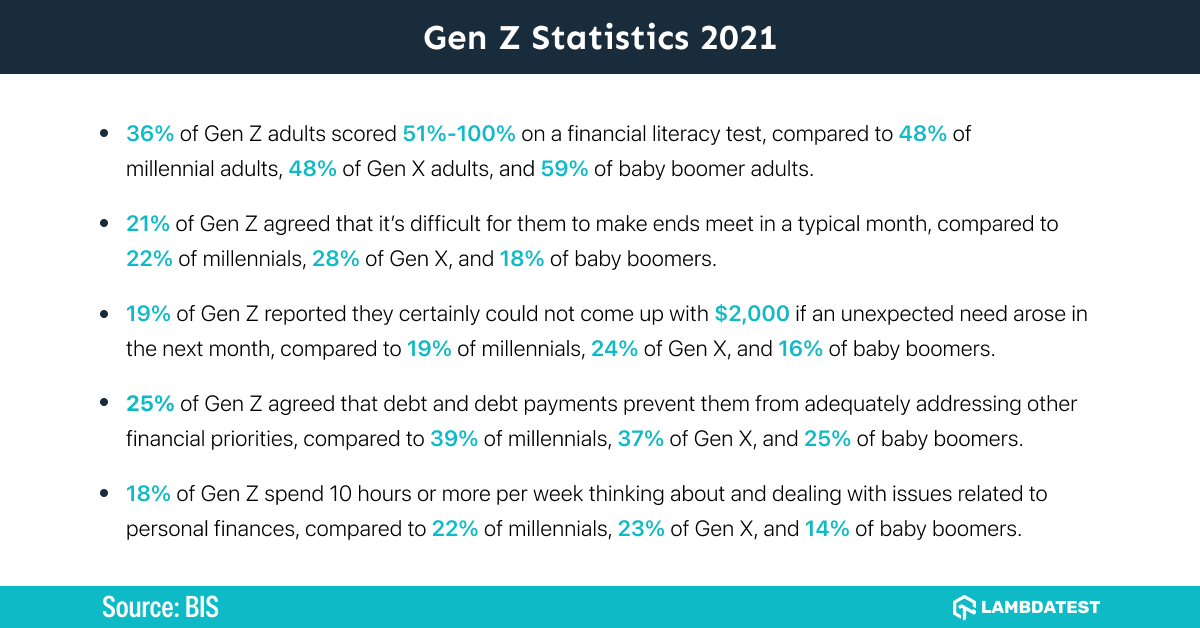
- In 2021, 36% of Gen Z adults scored 51%-100% on a financial literacy test, compared to 48% of millennial adults, 48% of Gen X adults, and 59% of baby boomer adults. (Global Financial Literacy Excellence Center)
- In 2021, 21% of Gen Z agreed that it’s difficult for them to make ends meet in a typical month, compared to 22% of millennials, 28% of Gen X, and 18% of baby boomers. (Global Financial Literacy Excellence Center)
- In 2021, 19% of Gen Z reported they certainly could not come up with $2,000 if an unexpected need arose in the next month, compared to 19% of millennials, 24% of Gen X, and 16% of baby boomers. (Global Financial Literacy Excellence Center)
- 25% of Gen Z agreed that debt and debt payments prevent them from adequately addressing other financial priorities, compared to 39% of millennials, 37% of Gen X, and 25% of baby boomers. (Global Financial Literacy Excellence Center)
- 18% of Gen Z spend 10 hours or more per week thinking about and dealing with issues related to personal finances, compared to 22% of millennials, 23% of Gen X, and 14% of baby boomers. (Global Financial Literacy Excellence Center)
Global Fintech Market
Digital peer-to-peer (P2P) lending, valued at $3.5 billion in 2013, is anticipated to grow to$1 trillion by 2025.
- In Q1 2022, there were 1,482 global fintech funding deals in total, up nearly 20% from Q1 2021. (CB Sights)
- The average annual cost for financial services like check cashing for the 9 million unbanked households in the U.S. is between $200 and $500. Through digital direct deposit, fintech enables people to avoid these costs. (NerdWallet and Forbes)
- According to financial analysts, the value of the world market for financial services is predicted to exceed $25,839 billion by 2022. (ReportLinker)
- According to research, using chatbots will enable banks to save about $7.3 billion by 2023. (Juniper Research)
- According to the 2022 Financial Services Global Market report, the market will reach $37,343 billion in 2026 at a compound annual growth rate of 9.6%. (ReportLinker)
- With more than 630,000 shares spread across 31 different stocks, ARK Invest has one of the largest fintech ETFs. At its peak in 2021, the ETF increased by 209%. (ARK Invest)
- While funding for the fintech industry fell by 33% QoQ from Q1 to $20.4 billion in Q2 2022, it was still up more than 112% from 2018 in terms of total funding. (CB Insights)
- By 2024, it is expected that global spending on blockchain solutions will have increased to $19 billion from $6.6 billion. (Statista)
- 94% of financial services executives think fintech will enhance customer experience and boost revenue in the future. (PWC)
- Between 2021 and 2022, the size of the global AI fintech market is anticipated to increase by 25% to $9.13 billion. (The Business Research Company)
- By 2023, it is predicted that artificial intelligence will save the insurance sector close to $1.3 billion. (Juniper Research)
- In five years, Ethereum, the second-largest cryptocurrency, increased from $11.95 to $4,644.43 per coin, a 38,765% increase. (Coin Market Cap)
- According to EMVCo, over 10.8 billion EMV chips will be in use by 2020 as a security standard for debit, credit, and prepaid cards. In places like Africa, Latin America, Canada, and more, usage has increased by 60 to 70%. (ReportLinker)
- In 2019, venture capital transactions valued at $26 billion were made in the US fintech market, a 54% increase from the previous year. (Accenture)

Software Testing Market
According to a survey conducted by Gartner, 50% of organizations plan to use AI for test automation by 2024.
- With 60%, deployed untested or broken code is the most common production bug in the software testing industry. (Hacker Rank)
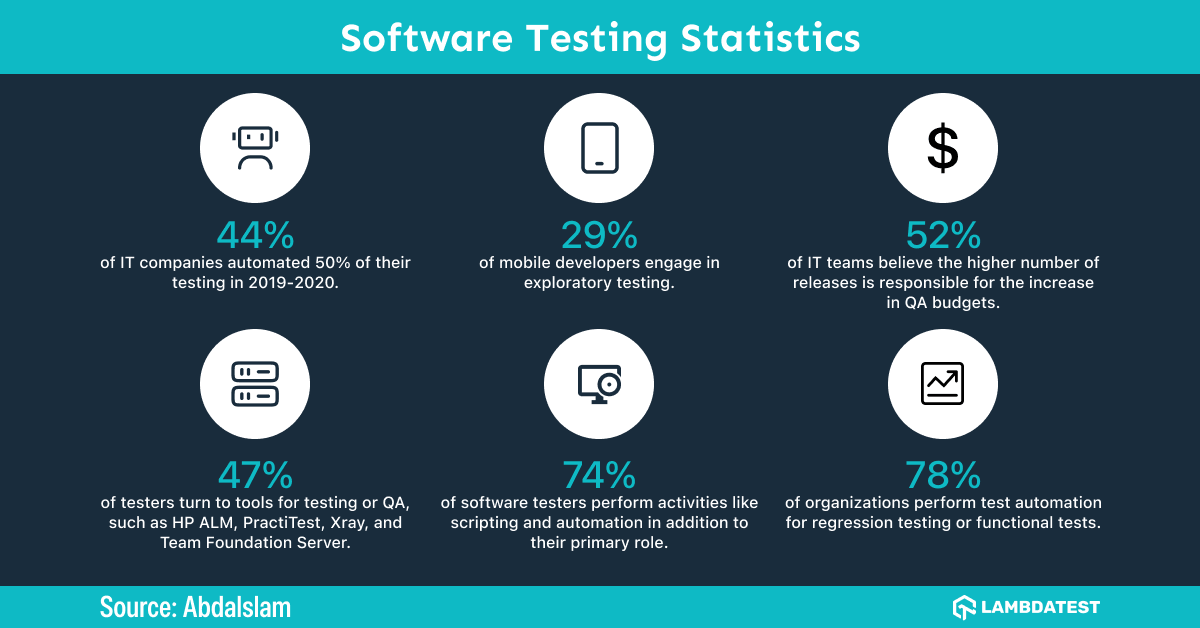
- 44% of IT companies automated 50% of their testing in 2019-2020. (RWS)
- The banking, financial services, and insurance segment accounted for 28.5% of the European software testing market in 2020. (Global Market Insights)
- 52% of IT teams believe the higher number of releases is responsible for the increase in QA budgets. (World Quality Report)
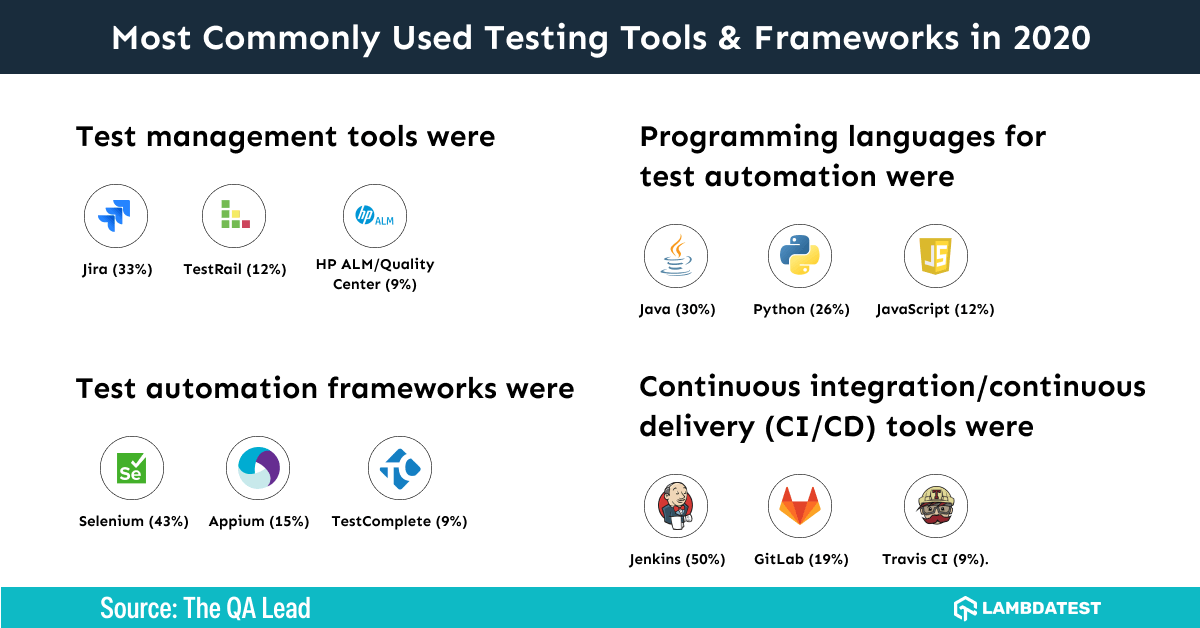
- 47% of testers turn to tools for testing or QA, such as HP ALM, PractiTest, Xray, and Team Foundation Server. (The QA Lead)
- According to research from JetBrains, Jira is the most popular issue tracker tool, preferred by 68% of developers. (JetBrains)
- 44% of QA teams claim that early participation in their company’s projects was very challenging. (Digitate)
- 74% of software testers perform activities like scripting and automation in addition to their primary role. (The QA Lead)
- 78% of organizations perform test automation for regression testing or functional tests. (Tarika Technologies)
- Around 87% of companies use an agile model in software development testing. After Agile, DevOps grew in 2019 to 36%, an 8% increase YoY. (The QA Lead)
- The global software testing market size was valued at USD 25.90 billion in 2019 and is expected to reach USD 50.84 billion by 2027. (Source: Grand View Research)
- The average time it takes to detect a data breach is 207 days, while the average time to contain a data breach is 73 days. (Source: IBM)
- The average cost of fixing a bug during the requirements stage of software development is USD 100, but the cost increases to USD 1,500 if the bug is detected during the maintenance stage. (Source: IBM)
- According to a survey conducted by Capgemini, 56% of IT professionals believe that their organization's software quality assurance processes are ineffective. (Source: Capgemini)
- As per the survey conducted in the year 2020, the most commonly reported software testing challenges are insufficient testing time (34%), lack of resources (33%), and difficulty reproducing defects (32%). (Source: TestRail)
- The average time it takes to fix a software bug is 16.5 hours, but the time can vary significantly depending on the complexity of the bug. (Source: Tricentis)
- The most common reason for software project failure is poor quality, accounting for 35% of all project failures. (Source: Software Testing Help)
- Agile development methodologies are the most popular approach to software development, with 71% of organizations using agile in some capacity. (Source: VersionOne)
- The average software development project has a defect density of 1-5 defects per function point. (Source: Software Testing Help)
- According to a survey conducted by Gartner, 45% of organizations plan to increase their investment in artificial intelligence (AI) for software testing by 2022. (Source: Gartner)
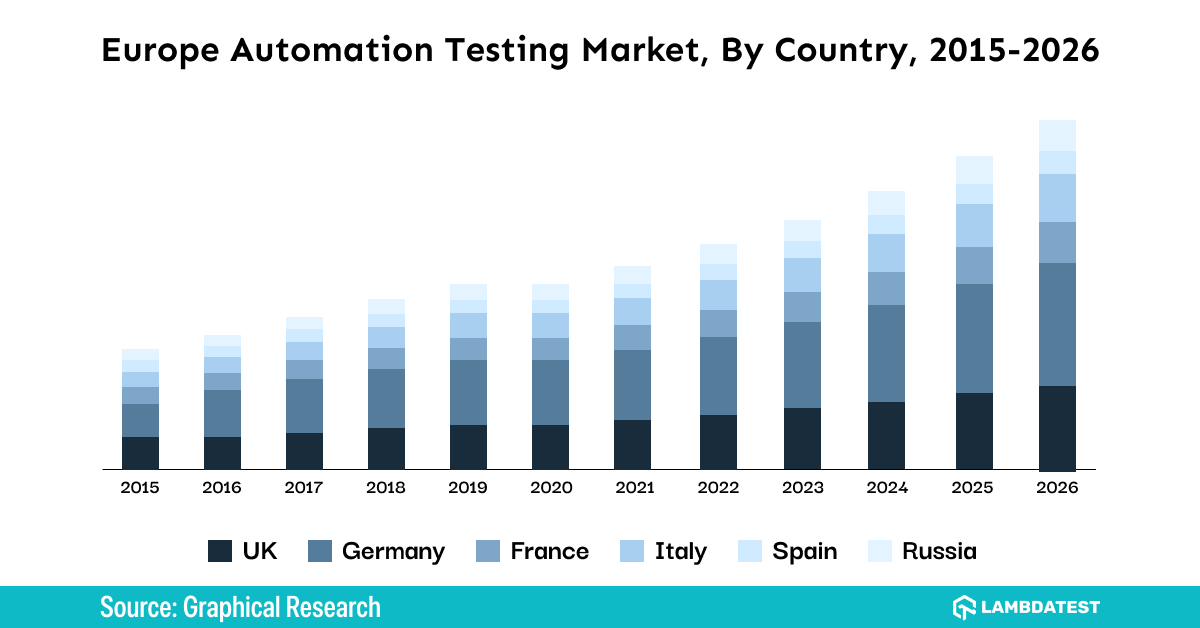
- The Europe Automation Testing Market was valued at over USD 3 billion in 2019 and is expected to grow at a rate of over 12.5% CAGR from 2020 to 2026. (Graphical Research)
- In 2020, the global market size of AI in software testing was USD 592 million, and it is expected to reach USD 1.5 billion by 2026. (Source: MarketsandMarkets)
- According to a survey conducted by the ISTQB, 70% of software testers have a bachelor's degree or higher. (Source: ISTQB)
- The average time it takes to execute a test case is 30 minutes, but the time can vary significantly depending on the complexity of the test case. (Source: Tricentis)
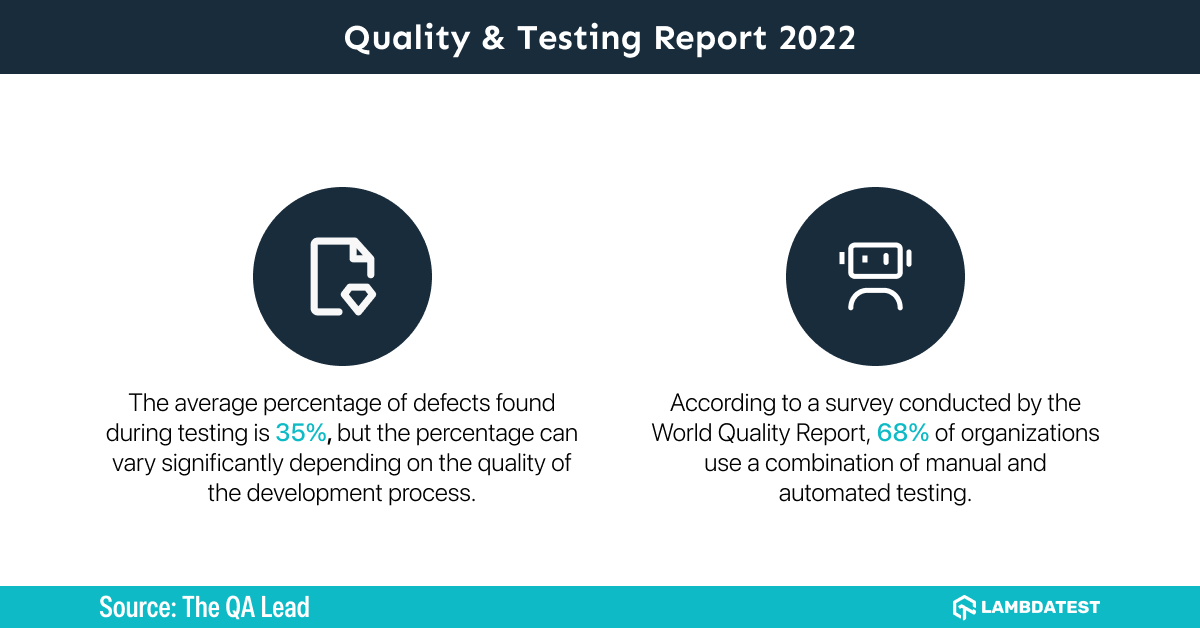
- According to a survey conducted by the World Quality Report, 68% of organizations use a combination of manual and automated testing. (Source: World Quality Report)
- The average cost of fixing a bug in production is 5-10 times higher than fixing it during the development stage. (Source: Tricentis)
- The average cost of fixing a bug in a legacy system is 5 times higher than fixing it in a modern system. (Source: Tricentis)
- According to a survey conducted by Capgemini, 48% of IT professionals believe that their organization's software testing processes are not integrated with the rest of the software development lifecycle. (Source: Capgemini)
- The average time it takes to deploy a software release is 7.8 hours, but the time can vary significantly depending on the complexity of the release. (Source: Tricentis)
- The average cost of implementing a test automation strategy is USD 500,000. (Source: Tricentis)
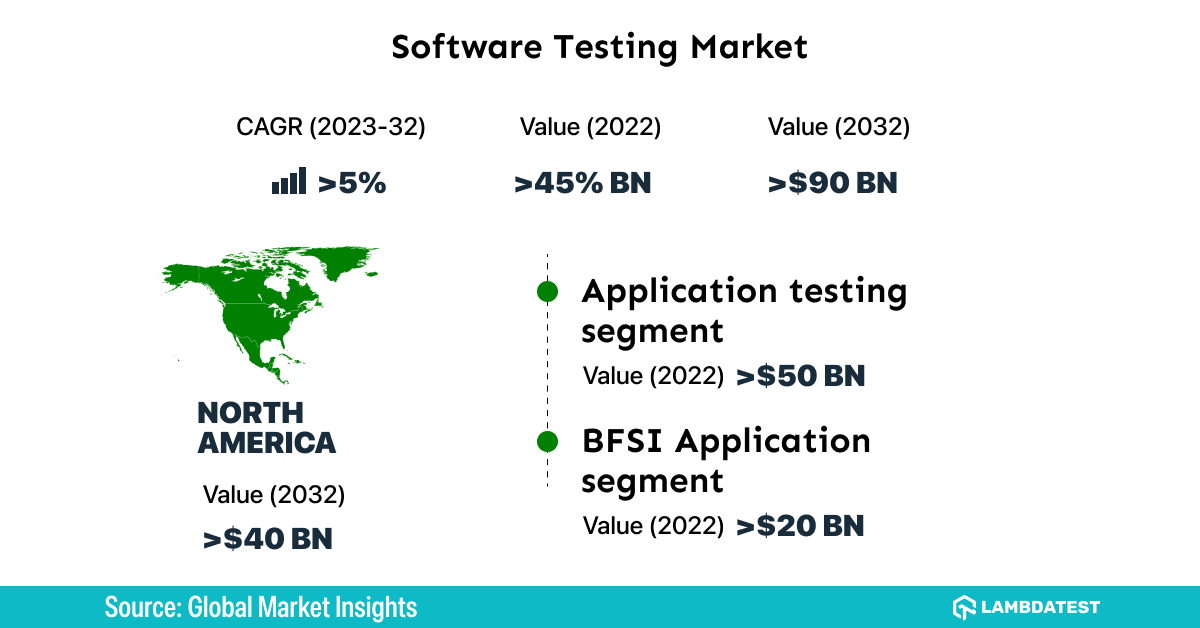
- The Software Testing Market size is valued at $45 billion in 2022 and is anticipated to grow at 5% CAGR from 2023 to 2032 due to the increasing usage of mobile-based applications. (GM Insights)
- According to a survey conducted by the ISTQB, 80% of software testers use a combination of manual and automated testing. (Source: ISTQB)
- The average time it takes to set up a test environment is 7 hours, but the time can vary significantly depending on the complexity of the environment. (Source: Tricentis)
- The average time it takes to triage a software defect is 1-2 days, but the time can vary significantly depending on the complexity of the defect. (Source: Tricentis)
- According to a survey conducted by the World Quality Report, 42% of organizations plan to use AI for defect prediction and prevention by 2022. (Source: World Quality Report)
- The average percentage of defects found during testing is 35%, but the percentage can vary significantly depending on the quality of the development process. (Source: Tricentis)
Combination of blockchain and finance produce secure systems for your apps, you can learn more about blockchain testing through our hub.
The automation testing market should reach $68 billion by 2025.
References
- Statista Research Department (2015, January 31). Value of global peer-to-peer lending from 2012 to 2025. Statista.
- Bureau of Economic Analysis (2019, December 20). Personal Income and Outlays. Bureau of Economic Analysis.
- Geo-Economics (2023, February 24). Global debt 2022 and other economy stories 2023. World Economic Forurm.
- Kelly Dilworth (2023, April 5). Average credit card interest rates. CreditCards.com.
- Chris Horymski (2023, March 27). State of credit cards in 2022. Experian.
- Primary Mortgage Market Survey (2023, April 6). 30-Year Fixed Rate Mortgage Average in the United States. FRED, Federal Reserve Bank of St. Louis.
- Foreign Exchange Trading (2022, October 27). OTC foreign exchange turnover. Bank of International Settlements.
- Matthew Johnston (2022, September 24). Biggest Companies in the World by Market Cap. Investopedia.
- Adroit Market Research (2022, September 20). Fintech (Financial Technology) Market to hit USD 699.50 Billion by 2030. GlobeNewsWire.
- Market Analysis Report (2022, September 20). U.S. Insurtech Market Size, Share & Trend Analysis. Grand View Research.
- Valuates Reports (2023, March 29). Global Trade Finance Market 2023. PR NewsWire.
- Angel One (2022, August 5). IPOs Are Underperforming with a Falling Global Market. Angel One.
- Shadaab K, Aarti G (2020, May). Peer to Peer Lending Market Outlook. Allied Market Research.
- Global Fintech Market Research Report Analysis (2023, March). Market Data Forecast.
- Zacks Equity Research (2021, November 22). Stock Market News 2021. Nasdaq.
- Gabriela Ramirez (2022, March 31). Financial Advisor Experience in U.S. UBS.
- Software Asset Management Market (2020, September). MarketsAndMarkets.
- Giacomo Tognini (2021, April 6). The Countries With The Most Billionaires 2021. Forbes.
- Global wealth management platform market size (2020, September). Fortune Business Insights.
- Tony Armstrong (2016, September 13). The Cost of Being Unbanked. NerdWallet.
- Tracking Tools Review 2019, JetBrains.
Frequently Asked Questions (FAQs)
What do you mean by financial statistics?
Analyzing and interpreting numerical data about financial markets, investments, and economic activity is known as financial statistics. Evaluating financial data and deriving insights that can guide business and financial decision-making involves using statistical techniques.
What is IMF in economics?
The International Monetary Fund also referred to as the IMF, is a non-governmental organization that supports economic stability and cooperation on a global scale. It works to maintain the stability of the international financial system in addition to offering financial support to members going through difficult times.
What is the use of financial statistics?
Financial statistics analyze financial data and offer perceptions of market and investment trends. They support informed decision-making by people and organizations when it comes to investments, risk management, and financial planning.
What are the 3 types of financial analysis?
The three types of financial analysis are ratio analysis, trend analysis, and comparative analysis. Ratio analysis involves analyzing financial ratios, such as profitability and liquidity ratios, to evaluate a company's financial performance. Trend analysis involves analyzing a company's financial data over time to identify patterns and trends. The comparative analysis involves comparing a company's financial data to that of its competitors or industry benchmarks.
What are the characteristics of financial statistics?
The attributes of financial statistics are precision, thoroughness, dependability, timeliness, and relevance. Financial statistics must be supported by precise and trustworthy data, give a comprehensive picture of the financial situation, be timely to be helpful for decision-making, and be pertinent to the particular financial analysis being done.
Did you find this page helpful?


