Performance Report
LT Browser now integrates with Google Lighthouse that allows you to view the performance report of your web-page instantly. Along with testing the website's responsiveness, you can now test your website performance statistics across 50+ pre-installed device viewports. The Performance Report allows you to view the score of:
- Desktop and Mobile
- Performance, Accessibility, Best Practices, SEO, and Progressive Web App
- Page Load Time and Browser Processing Time
To get started, you need to download the executable file from here.
How To View Performance Report On LT Browser?
Make sure you've installed the LT Browser, you will need to login to the LT Browser through your LambdaTest login credentials.
Step 1: Open the LT Browser. Select a device from the device List. For the demo, we are selecting 'Galaxy Note 9' and '13-inch Macbook Air'.
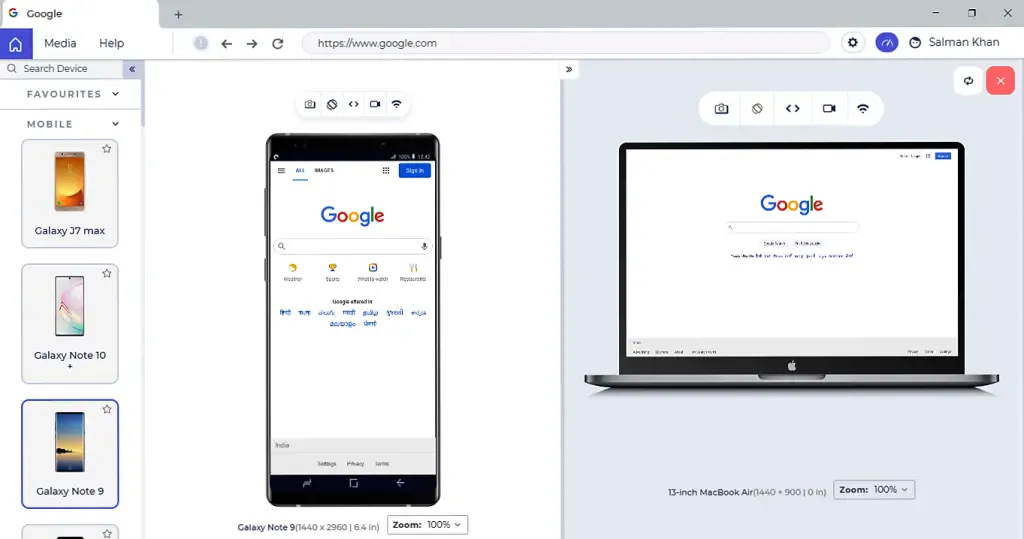
Step 2: Enter the 'URL' in the address bar and press the 'Enter' button.
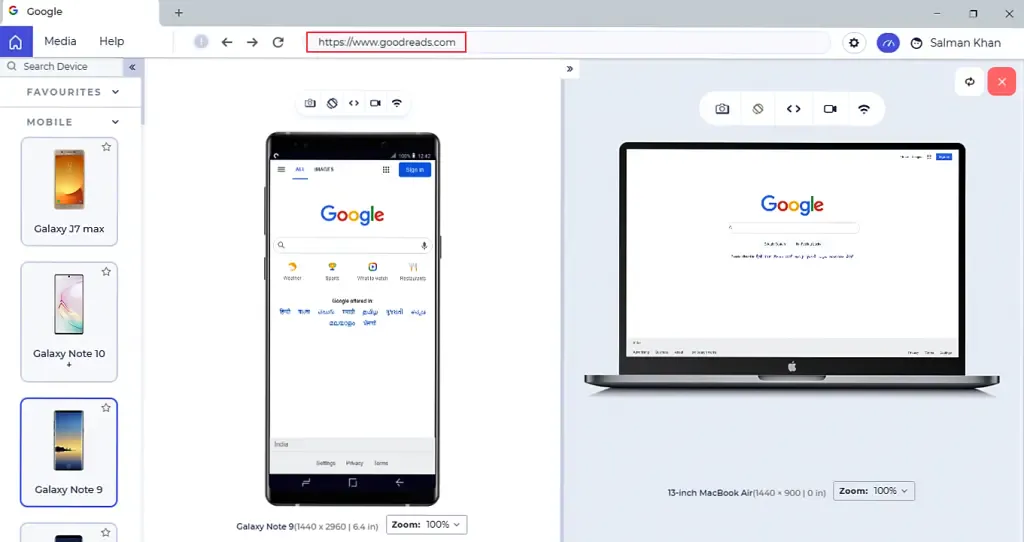
Step 3: Once the website is loaded over the selected device, click on 'Performance Report' button on the top-right.
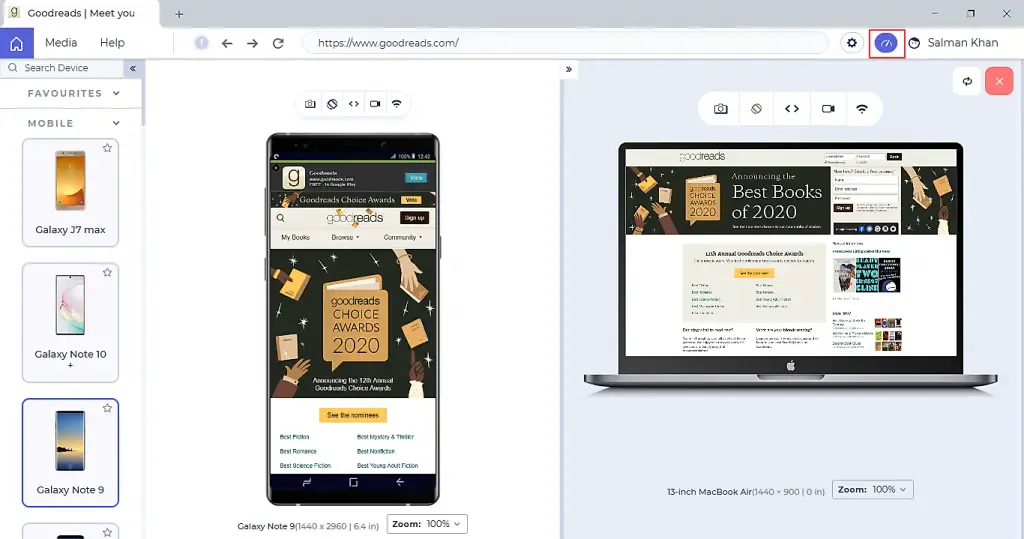
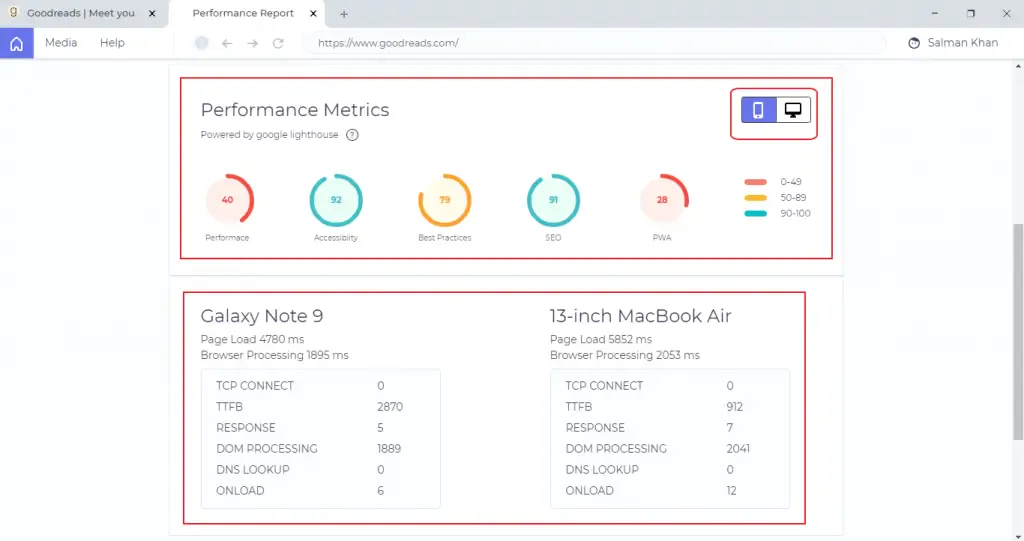
Once you click on the Performance Report button, a new tab of Performance Report would open up. You'll find all the performance statistics of the entered website and selected device. You can view:
1. Desktop Score And Mobile Score
Based on the performance of your website over different browsers, the desktop and mobile scores are generated. The score has three fields Poor, Average, and Medium.
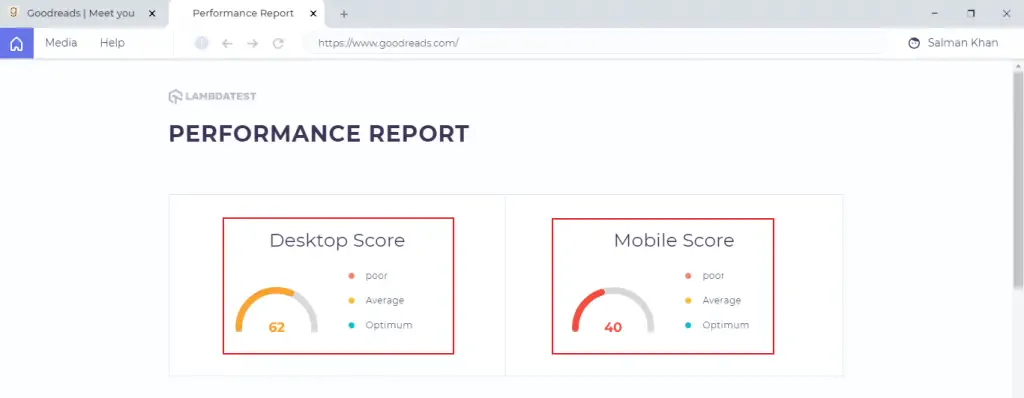
2. Performance Metrics
You can view the performance metrics of desktop and mobile by navigating to the desktop icon and mobile icon under the section Performance Metrics from the left.
3. Runtime Settings
In runtime settings, you'll find the URL of the entered website, time, and date.
That is all about the LT browser Performance Report. Don't forget to share you experience or questions with us. You can drop us an email through support@lambdatest.com or you could wave us a hello over our 24/7 chat support . Happy testing!
