Debugging Your Espresso Tests
Learn how to debug Espresso tests for your mobile applications to resolve different kinds of bugs for your failed tests/builds.
Objective
By the end of this guide, you will be able to:
- Resolve different kinds of bugs due to which your test/build failed.
- Understand the reasoning behind the same.
Debugging Tests
LambdaTest offers a variety of logs to help you locate the root cause:
- Instrumentation Logs
- Device Logs
- Network Logs
- Video Recording
Instrumentation Logs
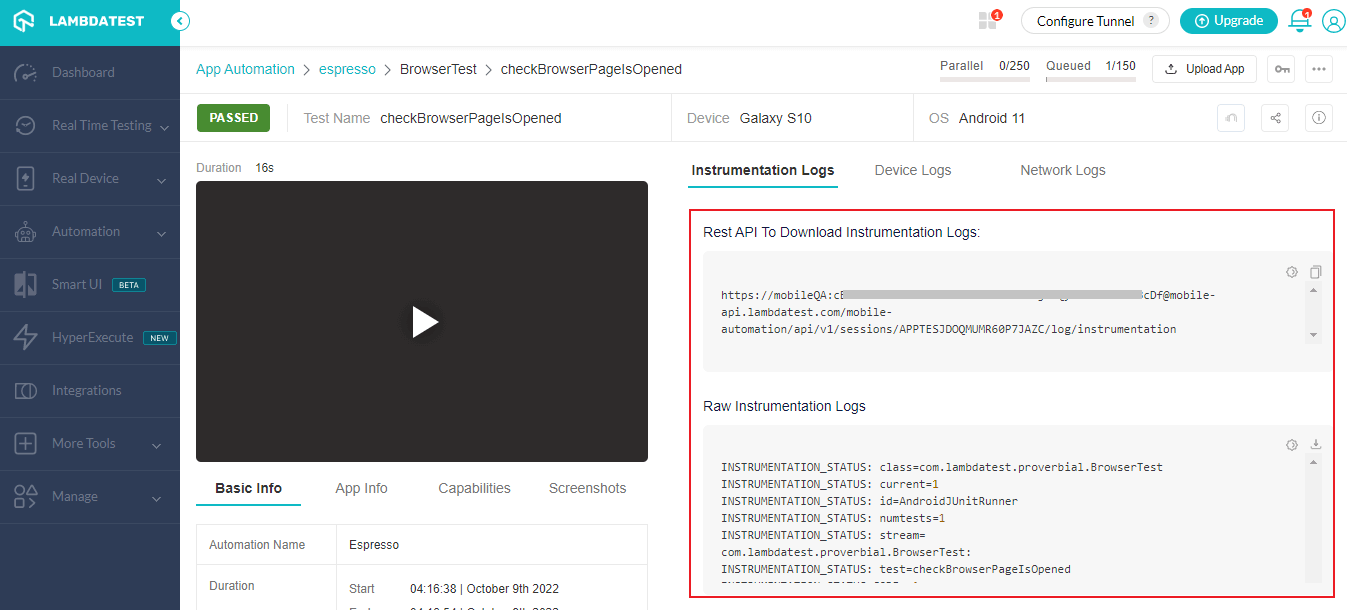
Instrumentation Logs are generated by the Espresso Test Runner. It generates the records of your test executions which are used to troubleshoot errors when a failure occurs.
You can also download the logs by clicking on Download Instrumentation logs.

Retrieving Consolidated Instrumentation Logs
In-depth insights into your test runs are crucial for effective debugging and optimization. When a more thorough understanding is needed, consolidated instrumentation logs play a pivotal role. Below, you'll find specific curl commands tailored to different scenarios.
Non-Sharded Builds
To access consolidated instrumentation logs for a non-sharded build:
curl -u "YOUR_LAMBDATEST_USERNAME:YOUR_LAMBDATEST_ACCESSKEY" \
--location 'https://mobile-api.lambdatest.com/mobile-automation/api/v1/framework/builds/<YOUR_BUILD_ID>/logs/instrumentation'
Replace <YOUR_BUILD_ID> with your actual build ID.
Sharded Builds
For sharded builds, use the following curl command:
curl -u "YOUR_LAMBDATEST_USERNAME:YOUR_LAMBDATEST_ACCESSKEY" \
--location 'https://mobile-api.lambdatest.com/mobile-automation/api/v1/framework/jobs/<YOUR_JOB_ID>/logs/instrumentation'
Replace <YOUR_JOB_ID> with your actual job ID.
Device Logs
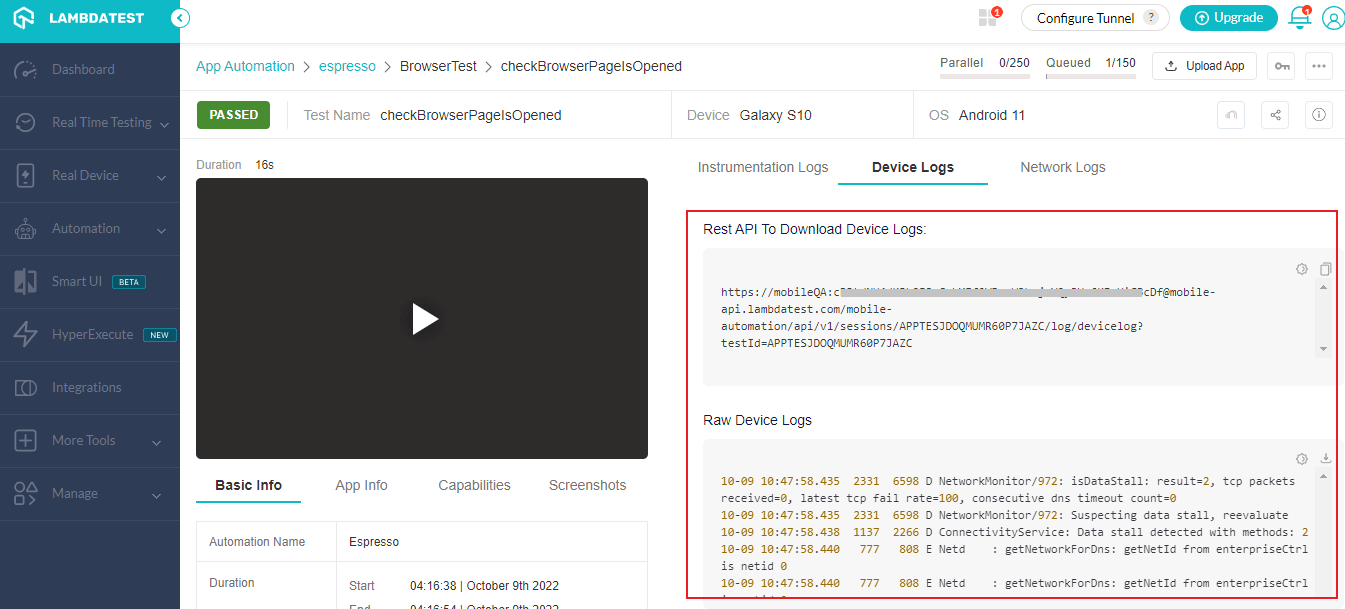
Device Logs are generated by the Android Logcat. They are extremely helpful to see all the actions that are being performed on the device.
It comes in really handy when an application crashes or any other failure occurs related to the application.
Device Logs are disabled by default & can be enabled by passing the deviceLog capability.

| KEY | VALUE | DESCRIPTION |
|---|---|---|
| deviceLog | TYPE: BOOLEAN DEFAULT: False deviceLog = falseOR deviceLog = true | Enable Device logs |
Network Logs Will Be Available Soon
Network Logs record Network traffic data in detail which will show us the latency & HTTP requests. They’ll come in handy when we need to test our application on different network parameters.
They’re disabled by default & can be enabled using the capability mentioned below:
| KEY | VALUE | DESCRIPTION |
|---|---|---|
| network | TYPE: BOOLEAN DEFAULT: FALSE network = TRUEOR network = FALSE | Enable network logs |
Video Recording
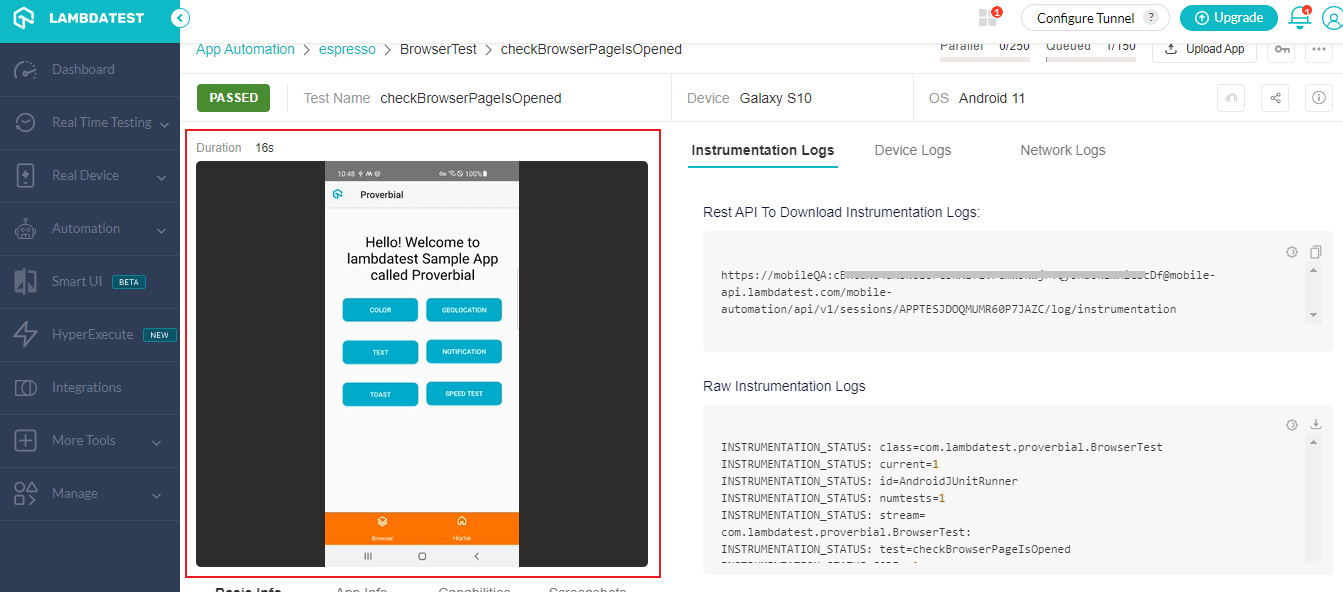
All tests executed on the LambdaTest Real Devices are recorded & the recording is viewable when you click on a Test. The video is downloadable as well so you can use it as you like.
By viewing this video recording, you can see where the test failed & the point from where it could not continue executing.

The video capability is enabled by default as mentioned below.
| KEY | VALUE | DESCRIPTION |
|---|---|---|
| video | TYPE: BOOLEAN DEFAULT: TRUE video= TRUEOR video = FALSE | Video recording of the complete screen |
Refer to our Espresso testing documentation for more capabilities.
If you still have any questions for us, please feel free to let us know via our 24X7 Chat Portal or mail us to support@lambdatest.com
