ChromeOS Web Browser Testing
This document outlines how to leverage features like mark as bug, changing IP geolocation, in-depth device logs and network logs, etc for your Real Time Web Browser testing.
Apart from these features, LambdaTest also offers you the
Steps to start your ChromeOS Web Browser Testing
Step 1: Click on the Real Time option from your LambdaTest dashboard.
Step 2: Click on the Virtual Mobile option in Web Browser Testing section.
Step 3: Select the ChromeOS option, and enter your URL in the space provided. (We are using the lambdatest website for the demo purpose)
Step 4: Select your screen resolution and click on Start button.
Device Controls
The Device Control feature allows you tp perform certain actions with your device within your current test session:
- Volume: Adjust the device volume directly within your testing session, ensuring optimal audio levels for your tests.
- Lock Device : Lock or unlock your device seamlessly during testing sessions without interrupting your workflow.
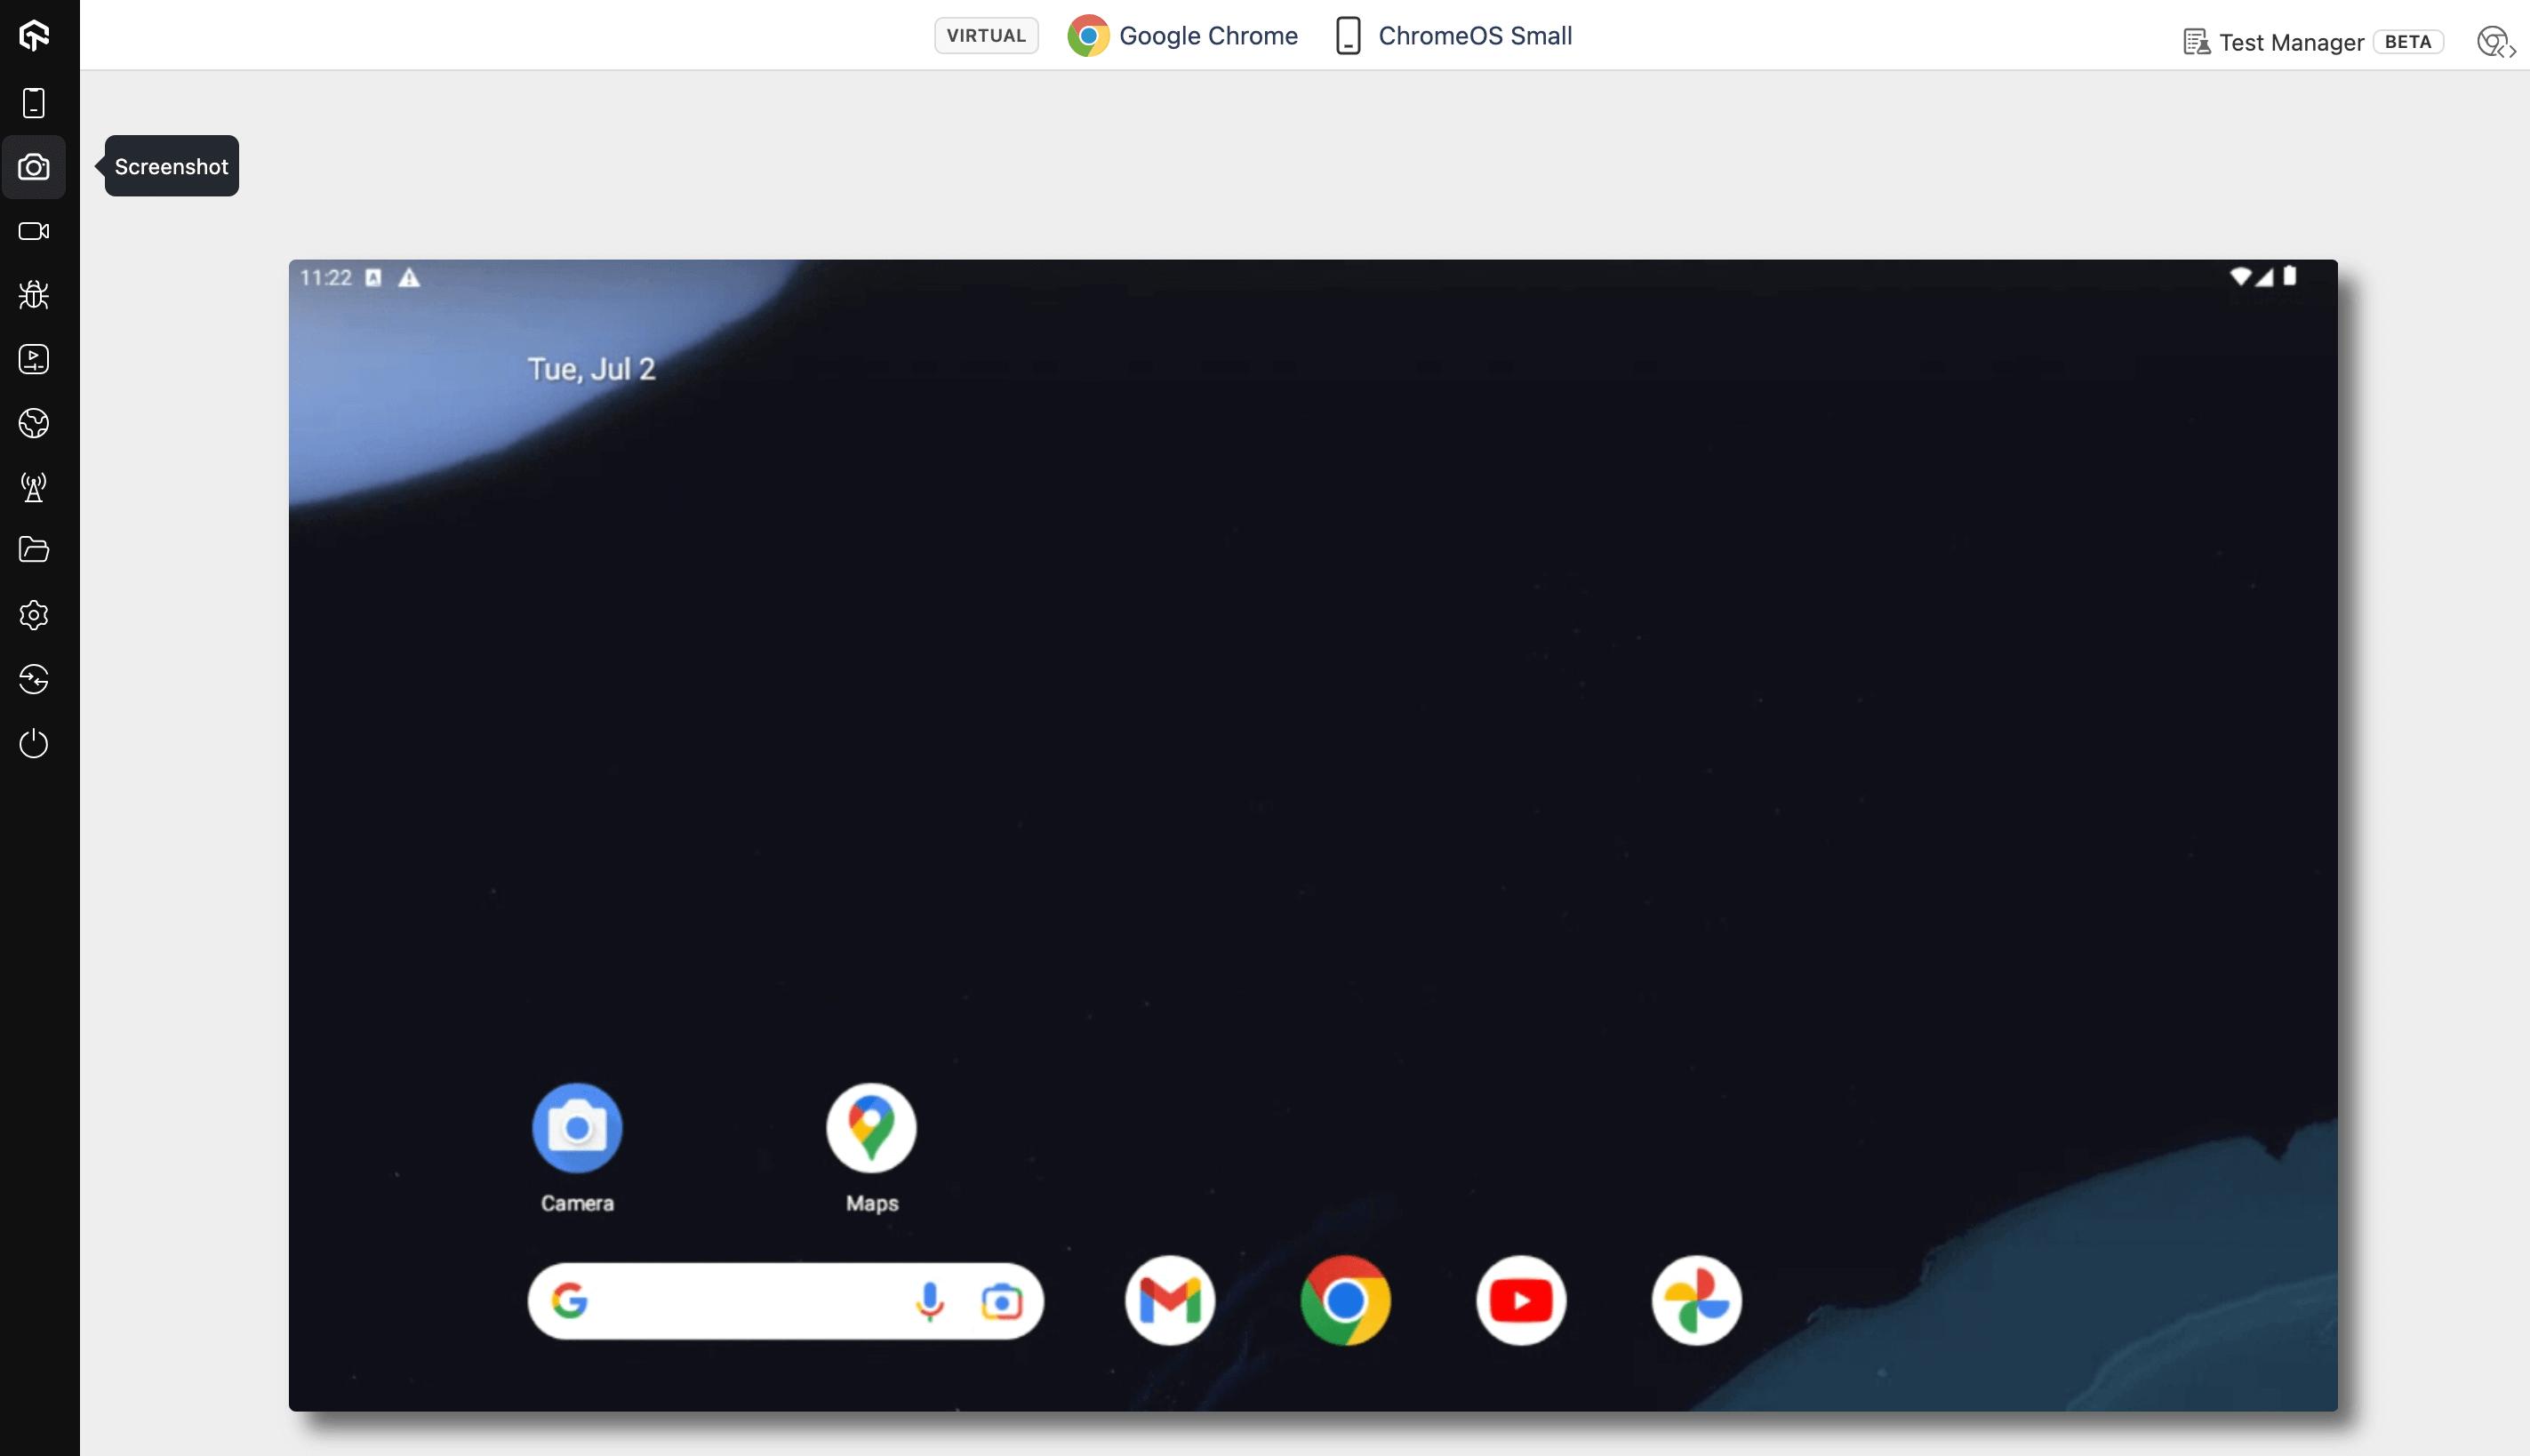
Screenshot
Capture clear screenshots of the current screen on your test device. Easily access and download these screenshots for future reference or bug reporting.
Record Session
Record your entire test session for detailed playback. A timer keeps track of recording duration, allowing you to pinpoint specific moments for review. You can click on the stop button to stop the video recording.
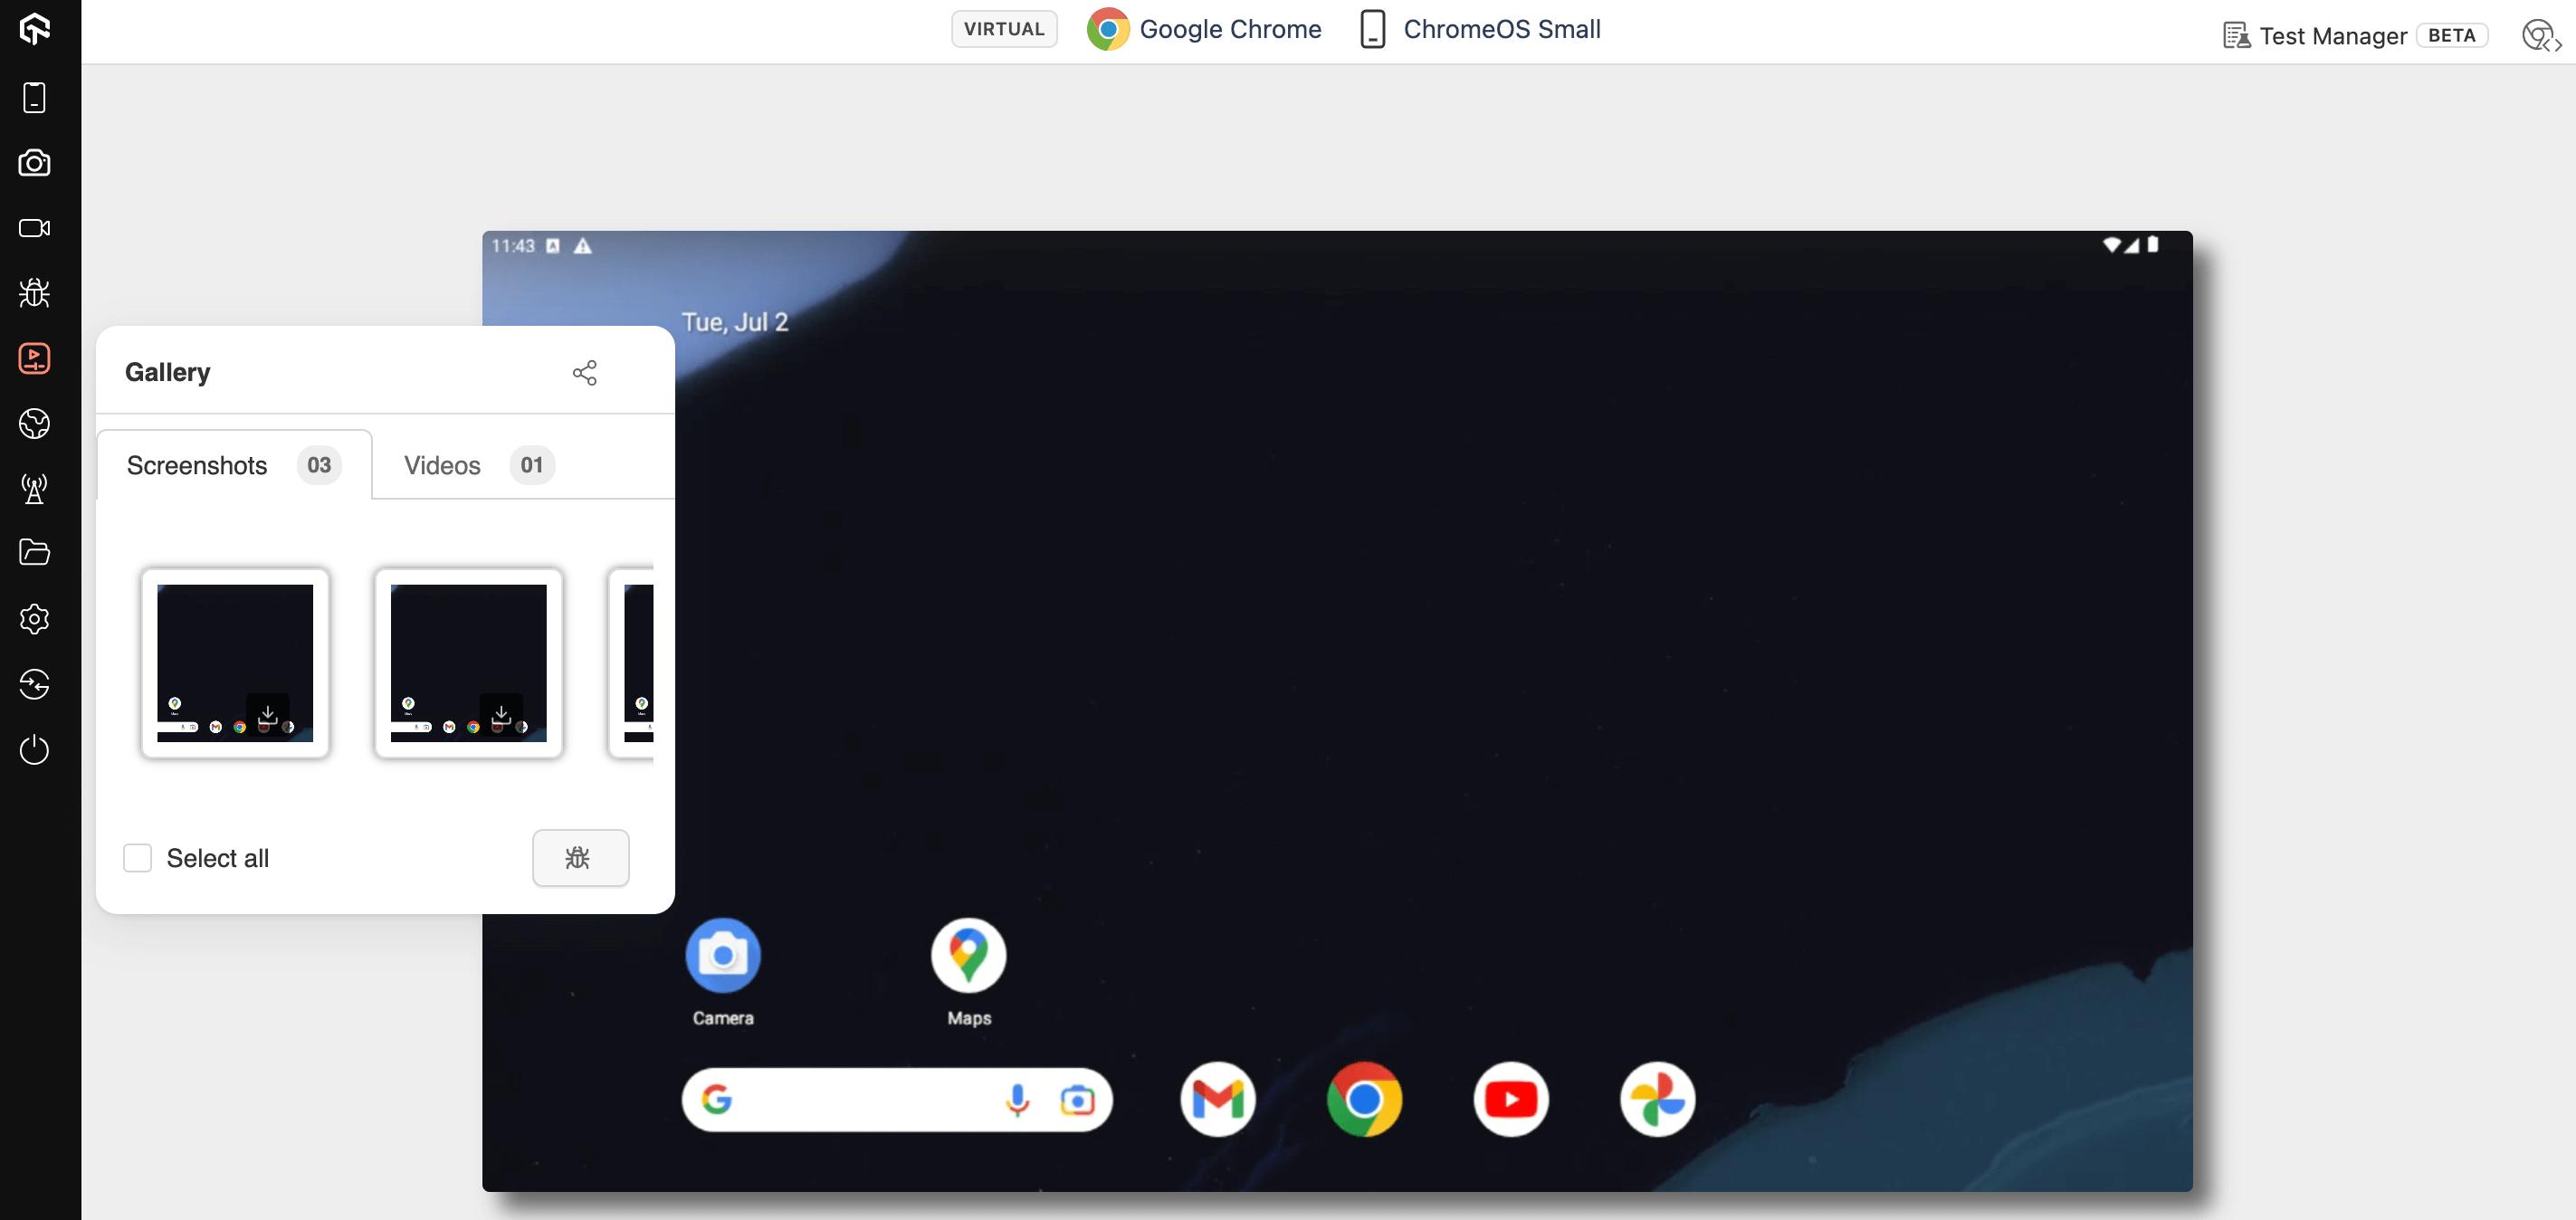
Gallery
All screenshots and video recordings from test sessions are stored in the Gallery. To access, select Gallery from the left toolbar and you'll find the saved screenshots and videos. To download the screenshots or videos to your local machine, click on the Download icon. You can also mark them as bug by clicking on the Bug icon.
Mark as Bug
This feature allows you to mark any bug in your UI during the session. You can mark the bug in your UI via different shapes, texts and of different colors. You can also configure different project management tools with your session to create a ticket for the same.
You can also share that bug, save the image to the gallery or download that screenshot.
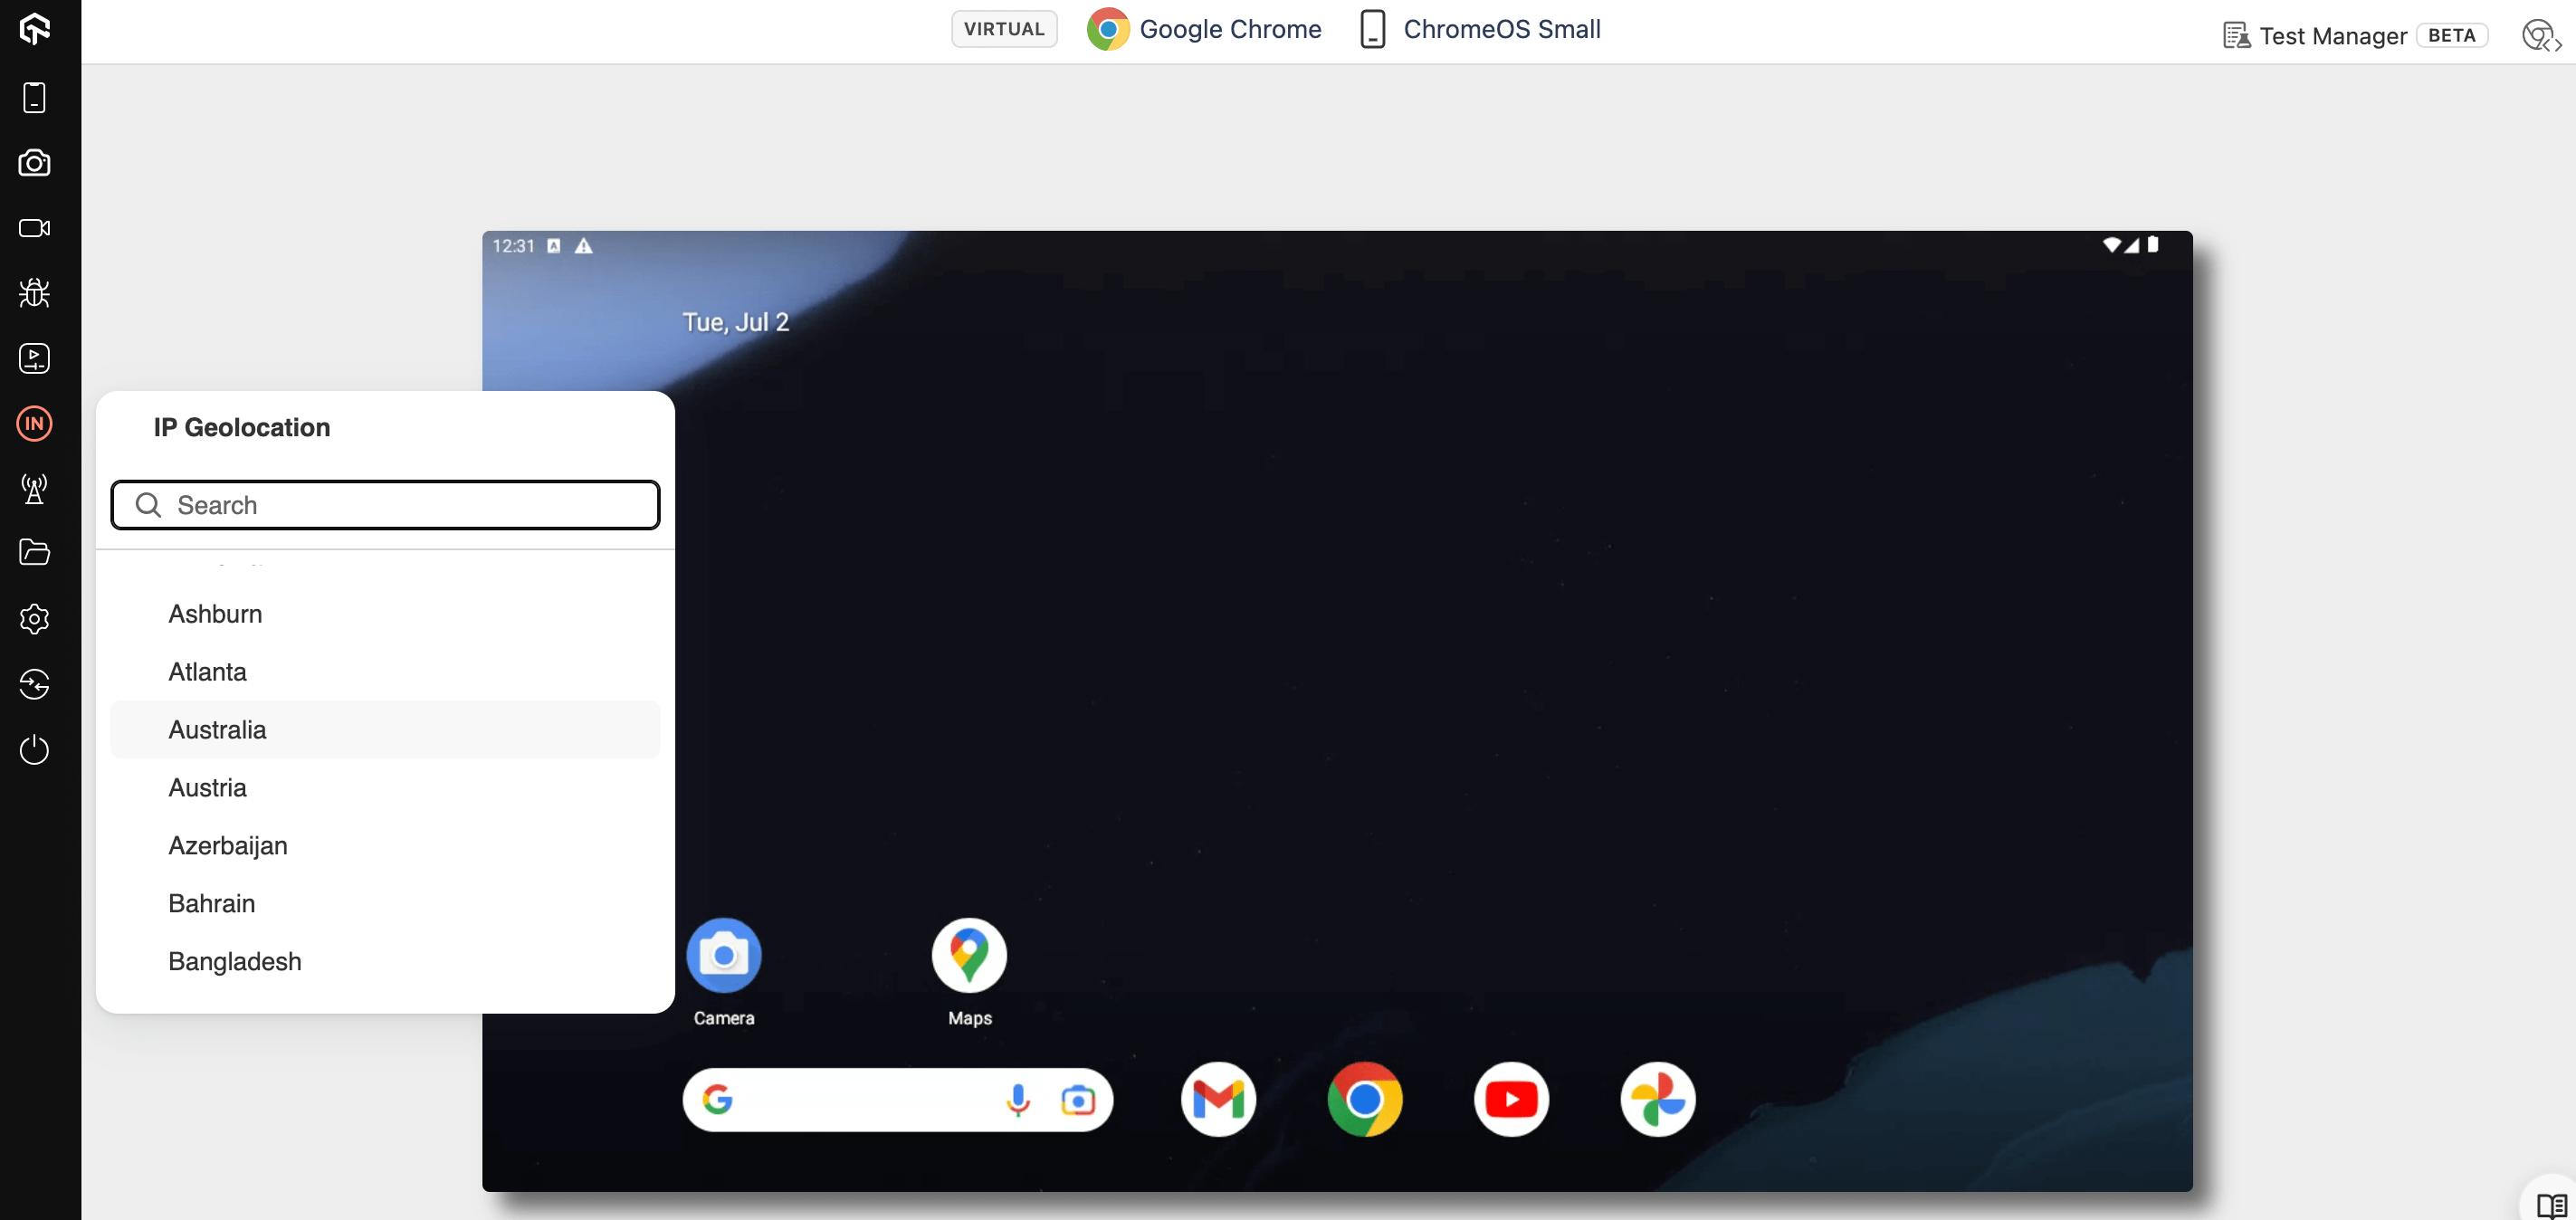
IP Geolocation
The IP Geolocation feature enables you to simulate website and mobile experiences from over 45 countries by using local IP addresses. This allows you to test localized features such as pricing, languages, and product offerings. With IP Geolocation enabled, you can verify that your app's traffic is coming from a specific country, allowing for comprehensive global testing.
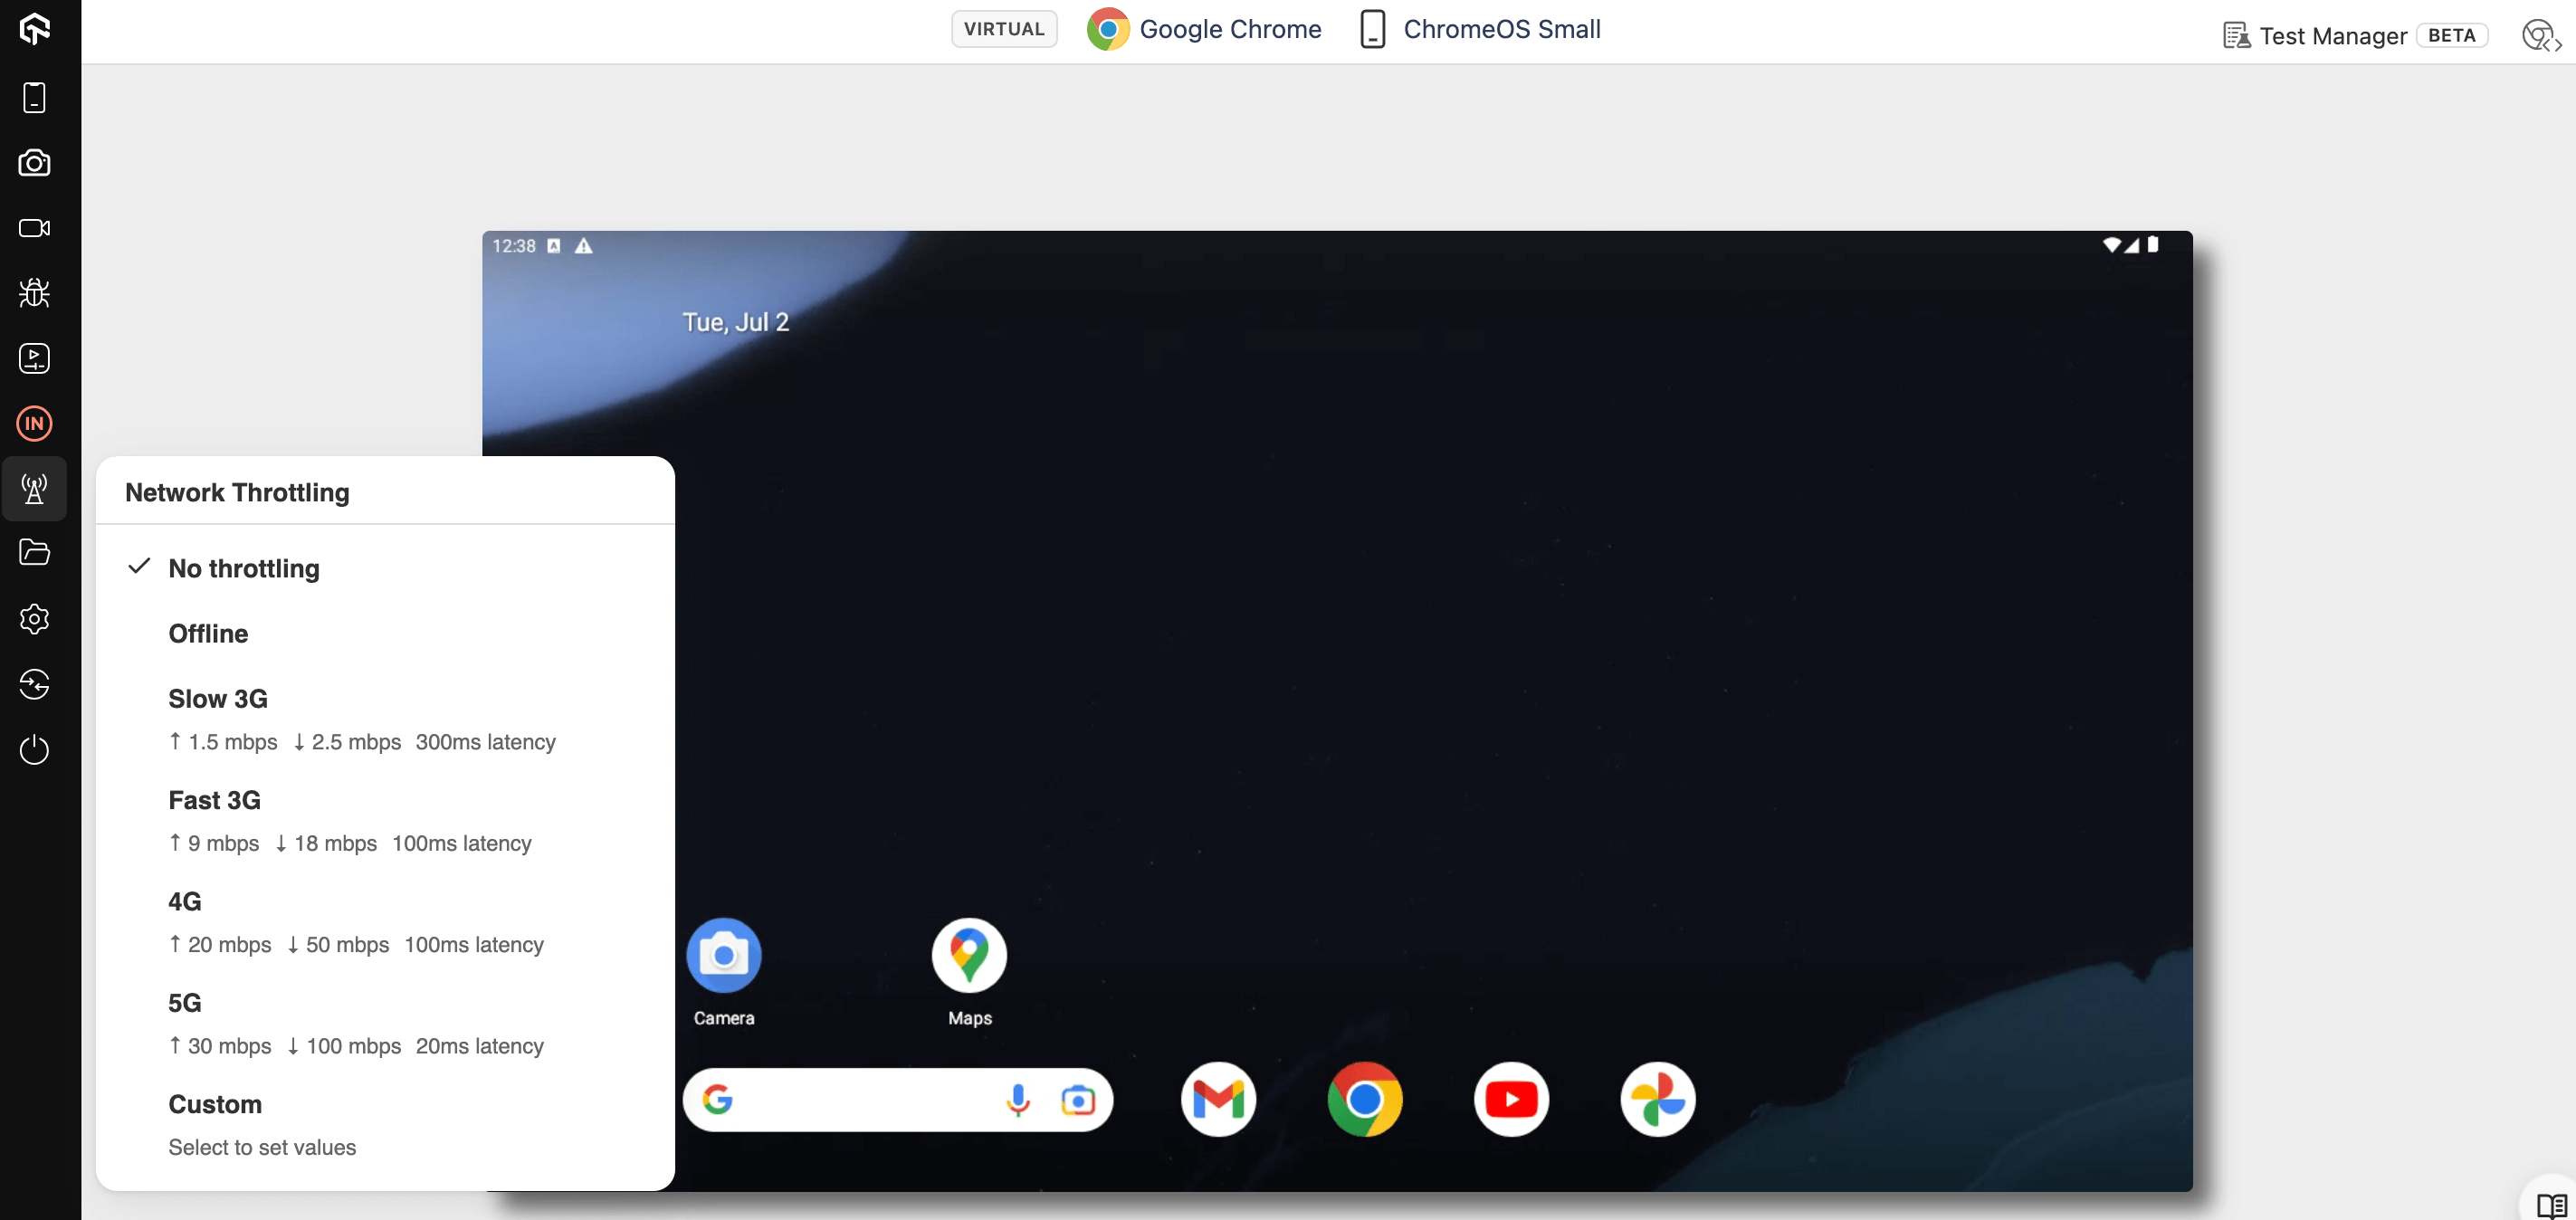
Network Throttling
LambdaTest's network throttling feature empowers you to simulate real-world network conditions (2G, 3G, LTE) during testing. This allows you to assess your application performance under varying internet speeds, ensuring a seamless user experience across different network environments. You can leverage predefined network profiles or craft custom settings for comprehensive testing.
Settings
The settings section offer the following features:
- Idle Timeout : This feature allows you to set the idle timeout for your test session. The default Idle Timeout is 5 minutes and the maximum limit is 60 minutes.
- Time Zone : With this feature, you can select the time zone of your preferred region that align with your testing needs.
- Keyboard Input With this feature, you can change the language in your test session for a more localized testing experience.
Switch
This feature allows you to switch between devices, browser and their OS versions without exiting your current test session.
End Session
By clicking on the end session button, you can close your current test session.
Advance Tools
Chrome DevTools
Chrome DevTools offer a comprehensive suite of features to inspect and debug web pages. Here's how DevTools can help you with styles, event listeners, DOM breakpoints, properties, and accessibility:
- Styles: Inspect and modify CSS styles directly on the webpage. See applied, inherited, and final computed styles.
- Event Listeners: View, disable, and set breakpoints on event listeners associated with elements to debug event handling.
- DOM Breakpoints: Pause script execution when specific changes occur in the DOM tree for efficient debugging of dynamic content.
- Inspect & Modify Element Properties: View detailed information about each element, including type, class names, IDs, attributes, and JavaScript variable values. Modify properties for testing or temporary adjustments.
- Accessibility Tools: Identify and address potential accessibility issues with the built-in audit tool, color contrast checker, and vision deficiency simulator.
