How To Generate HTML Reports With WebdriverIO?
Aparna Gopalakrishnan
Posted On: February 1, 2022
![]() 58071 Views
58071 Views
![]() 14 Min Read
14 Min Read
This article is a part of our Content Hub. For more in-depth resources, check out our content hub on WebdriverIO Tutorial.
Reporting is an inevitable factor in any test automation framework. A well-designed and developed framework should not just let you write the test cases and execute them, but it should also let you generate the report automatically. Such frameworks allow us to run the entire test scripts and get reports for the complete project implementation rather than for the parts separately. Moreover, it contributes to the factors that determine the decision to choose a framework for Selenium automation testing.
Without a good report, even if the scripts are great, it is very difficult to find the bugs through automation. A nice and comprehensive report at the end of an automated test execution will help to summarize and conclude the test run.
In this Selenium WebdriverIO tutorial, we will discuss different WebdriverIO HTML reporters.
Starting your journey with Selenium WebDriver? Check out this step-by-step guide to perform Automation testing using Selenium WebDriver Tutorial.
TABLE OF CONTENTS
What is Reporting in WebdriverIO?
WebdriverIO is an independent implementation of Webdriver protocol and is supported by all browsers. It provides a true cross browser testing experience.
In addition to that, WebdriverIO also supports an alternate automating solution based on the Chrome Dev Tools protocol. This means that WebdriverIO can be used for automating browser using Puppeteer.
WebdriverIO supports a variety of reporting methods. They can be classified into Webdriver IO HTML reporters and non-HTML reporters. Let us have a quick look at the classification and then deep dive into HTML reporting methods.
WebdriverIO Non-HTML Reporters
Any reporting method other than Webdriver HTML reporter would fall into this category. WDIO supports a number of non-HTML reporting of which we will discuss a few of them as mentioned below:
- Dot Reporter
- Spec Reporter
- JUnit Reporter
- Video Reporter
- JSON Reporter
- Markdown Reporter
Dot Reporter
Dot Reporter is the default reporting format of the WebdriverIO framework. It is a method in which test execution results are displayed in the console. ‘Dot’ in this reporting format indicates the number of test cases.
For example, if only one test case is executed, the reporter will show one dot. And if there are three tests, three dots will be displayed in the log. Suppose if one test failed out of the three tests, the reporter will show something like “..F”. This means that out of the three tests, one test is failed and marked as F in red color as shown in the below demonstration.

Spec Reporter
Spec Reporter is similar to the Dot Reporter but slightly better in terms of reporting the test results as it represents the results in readable statements.

JUnit Reporter
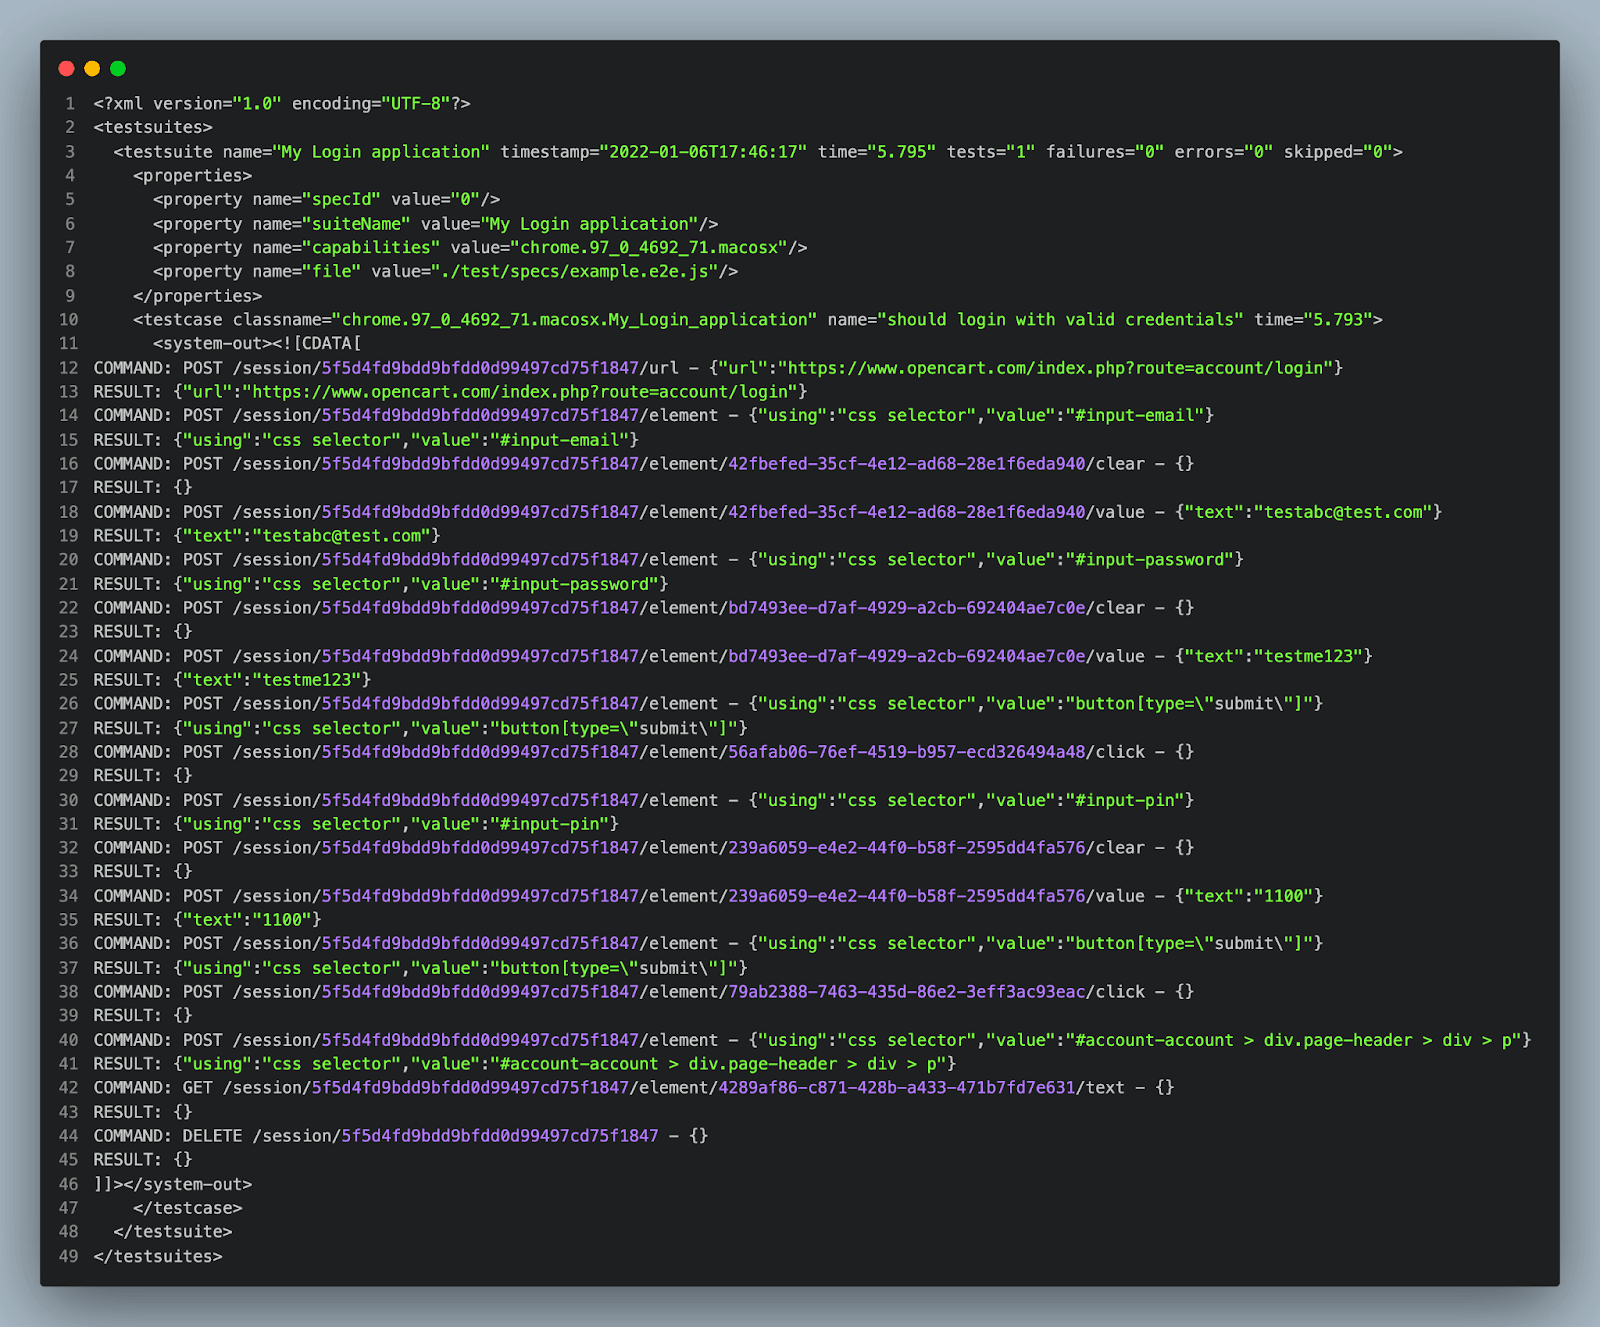
JUnit Reporter generates Jenkins compatible XML reports. Anyone who has worked on the JUnit framework will be familiar with the JUnit reports. JUnit Reporter is a plugin that can be used to generate such an XML report. This is much better than Dot Reporter as it’s more readable and gives in-depth details about the test execution.
The configuration is shown below:
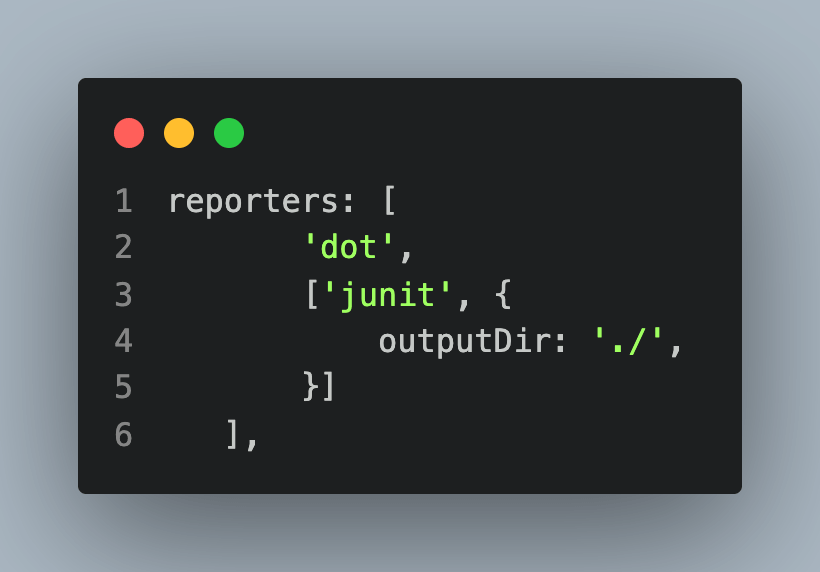
This would generate a log with JUnit XML after the test is executed, as shown below:
Also read – How To Generate TestNG Reports In Jenkins?
JSON Reporter
JSON Reporter is a reporting method to generate JSON reports. We know JSON reports are a very detailed reporting method that consists of every detail of the test execution.
Although it’s a very detailed reporting method, too much information could also impact the readability of the report and hence the usability as well (unless the report JSON file is integrated into one of the CI (Continuous Integration) tools or plugins)
Configuration is shown below:
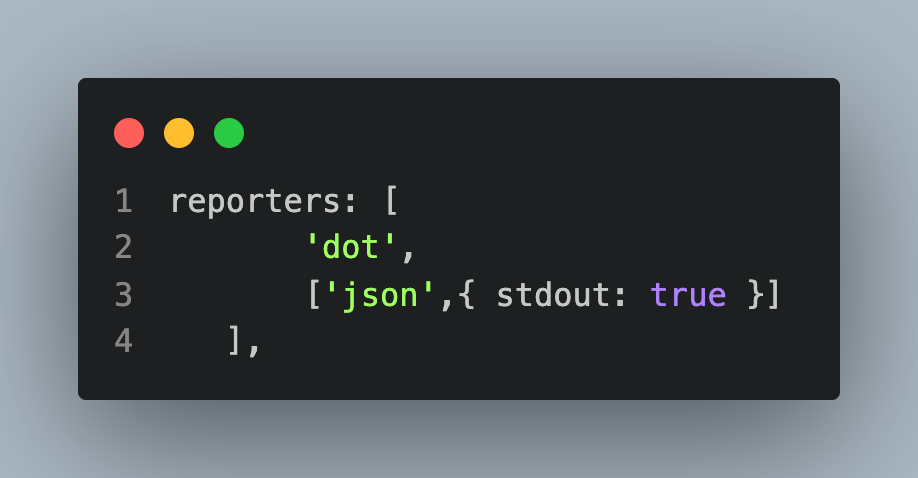
And the JSON log is shown below:

Markdown Reporter
If you are looking for a very textual reporting but with a little formatting/beautification (like a Readme file), then that would be the Markdown Reporter.

So far, we have discussed some of the non-HTML reporting methods that WDIO supports and saw that all the above reporting methods contain details of test execution.
These methods are probably helpful in debugging a small suite of tests, especially with Dot and Spec Reporter. However, something remains missing – a consolidated readable, simple representation of the test execution. So, this observation itself tells us the need for HTML Reporting methods. So, let us find out the different HTML reporting methods in WebdriverIO.
Also read – Generating XML And HTML Report In PyUnit For Test Automation
You can take this certification as proof of expertise in the field of Selenium automation testing with JavaScript to empower yourself and boost your career.
Here’s a short glimpse of the Selenium JavaScript 101 certification from LambdaTest:
WebdriverIO HTML Reporters
There are different types of WebdriverIO HTML reporters that support various integrations (Mocha, Jasmine, Cucumber, etc.). The most used ones are:
- Timeline Reporter
- HTML Reporter
- Allure Reporter
Before we deep-dive into WebdriverIO HTML reporters, please note the below prerequisites and considerations for the demonstration and hands-on examples.
Pre-requisites:
- Visual Studio Code IDE is installed.
- WebdriverIO is already installed and ready to use. To get started with WebdriverIO, please go through the tutorial on WebdriverIO Tutorial With Examples For Selenium Testing.
- In this example, we use the mocha-WebdriverIO test to demonstrate the reporting.
- Below is the snapshot of the test that we use in the demo (test to login to OpenCart application)
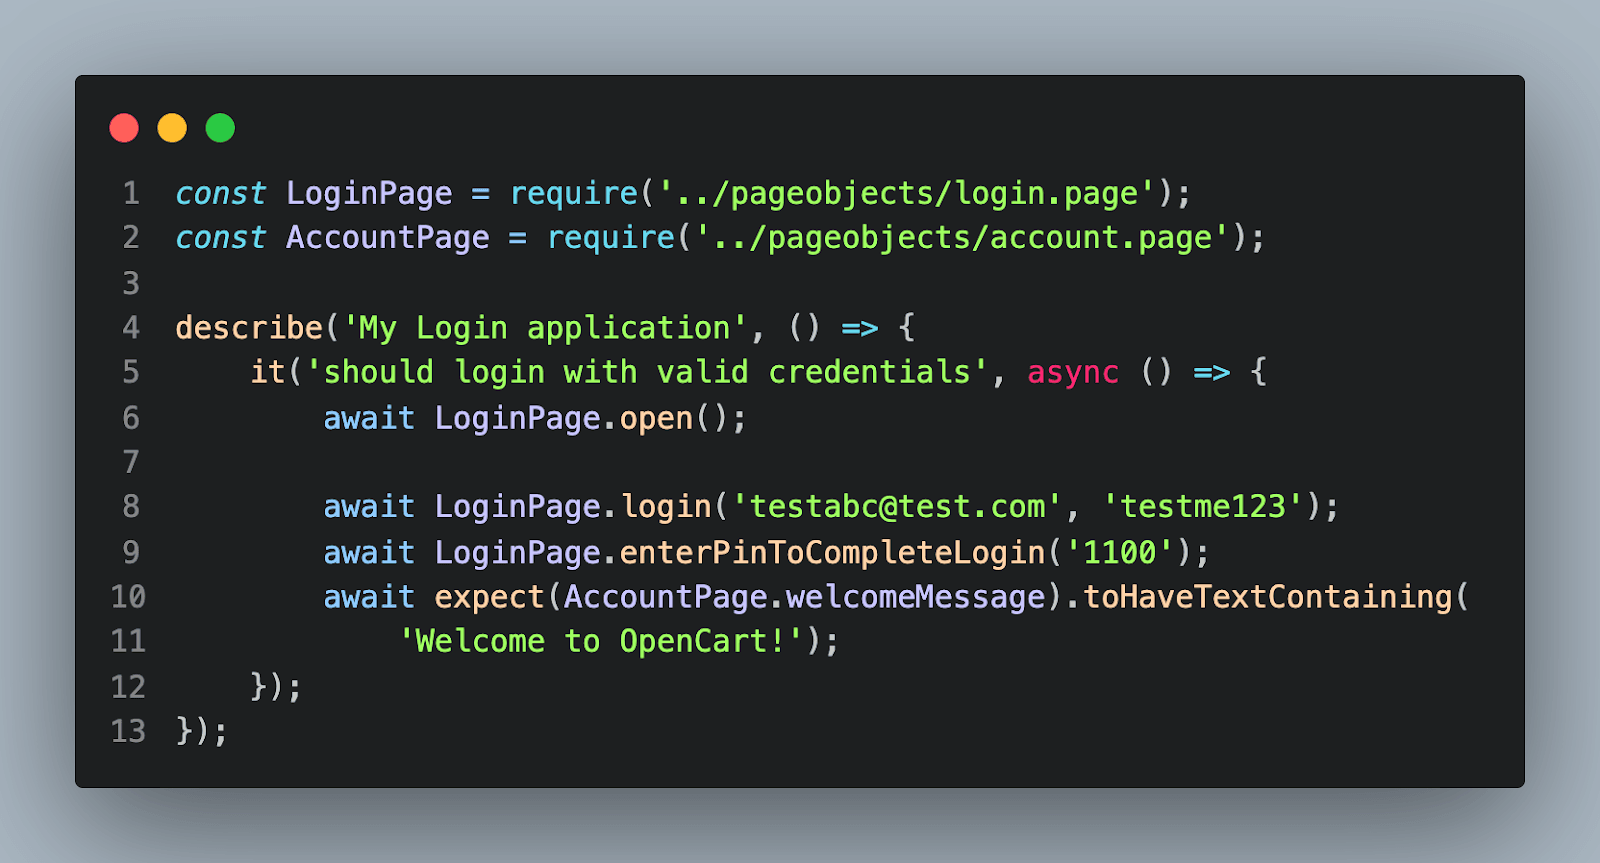
The test can be executed either on your local or on cloud Selenium Grid, like LamdaTest – the cross-browser/OS cloud testing platform using the command: npm run wdio
Selenium testing tools like LambdaTest is a cross browser testing platform that can be used to perform automated and manual (live) interactive testing on 3000+ real browsers and operating systems online.
The example uses LamdaTest to execute the test. To get the test running on LambdaTest, update the wdio.config as follows:
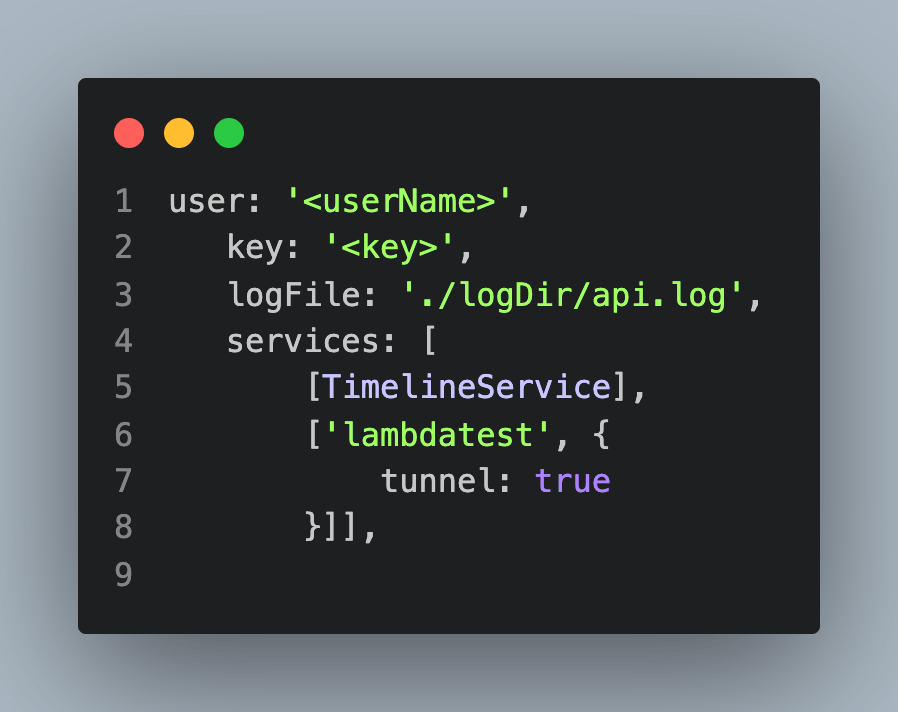
Here userName and key are the unique ones associated with your account. Please update the code accordingly after cloning the project. You can register on LambdaTest and get the Username and Access Key from the LambdaTest Profile Section.
Now let us look into the WebdriverIO HTML reporters in detail.
Also read – Cross Browser Testing With WebDriverIO [Tutorial]
Timeline Reporter
Timeline reporter is one of the most popular WebdriverIO HTML reporters that gives an aggregated visualization for your test results. It’s a very simple but very useful report framework. This report shows the test execution details nicely with a clear differentiation of passed, failed, and skipped tests. One can also attach screenshots in the html report using this reporting method.
Some of the high-level features, installation and usage (implementation) of Timeline Reporter is described below:
Timeline Reporter Features:
Here are some of the features of Timeline Reporter while working with WebdriverIO:
- Works great with Mocha and Jasmine frameworks. Though it works with Cucumber, every step of the Cucumber test will be reported as a test.
- Detailed reporting of the test with screenshots.
- Error stack trace attached to test.
- No post-processing is needed. Once the test run is complete, an HTML report will be generated.
- Test results filtering capability in the report (Ideal for debugging failure scenarios)
This Selenium JavaScript tutorial for beginners and professionals will help you generate Mocha reports with Mochawesome while working with JavaScript for Selenium automation testing.
However, you can visit the LambdaTest YouTube channel for more videos on Cypress Testing, Selenium testing, etc., so there’s never a shortage of learning opportunities.
Timeline Reporter Installation:
In this example, we use the Mocha-WebdriverIO test to demonstrate the reporting, assuming that WebdriverIO is already installed and ready to use. Below is a simple test written to log in to OpenCart.
- First, we need to install wdio- timeline-reporter using the following command:
npm install --save wdio-timeline-reporter - Once it is done, a dependency will be added to your package.json.
|
1 2 3 |
"dependencies": { "wdio-timeline-reporter": "^5.1.4" } |
Timeline Reporter Usage:
- First, we need to import the wdio-timeline-reporter to the wdio.conf.js file:
- Then in the same file, add ‘timeline’ to the reporters, and in options, set the directory name where we wish to see the HTML report. In this example, we will store them in the results folder.
- You can keep/remove spec – it has no dependency with the timeline report, but just to see the logs in the console.
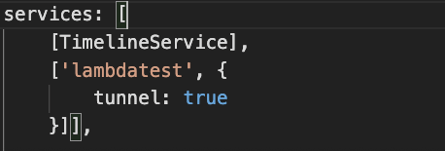
- Also, in services, add [TimelineService]. Since we are running the tests in LambdaTest, we should add “lambdatest” in the services too.
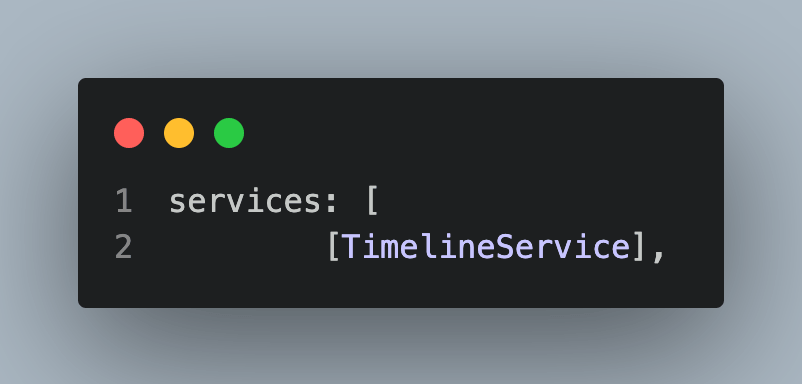
Please note that we have already added “lamdatest” services in “services” as part of the pre-requisites so that the tests will run on LamdaTest. - In case, if you want to execute in your local machine, remove the “lamdatest” service from the “services” array.
- Now, let’s run our test to see the timeline report. I have used the native script to run WDIO in this example. (i.e. npm run wdio).
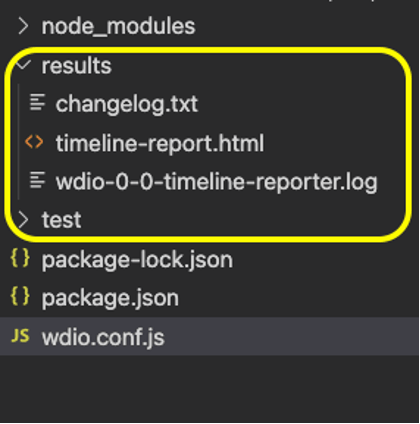
- Once the test is run, we will be able to see the ‘results’ folder (that is what we have given the path to keep reports) created, and a report with the name “timeline-report.html” is generated, as shown below.


And the report would look like this:
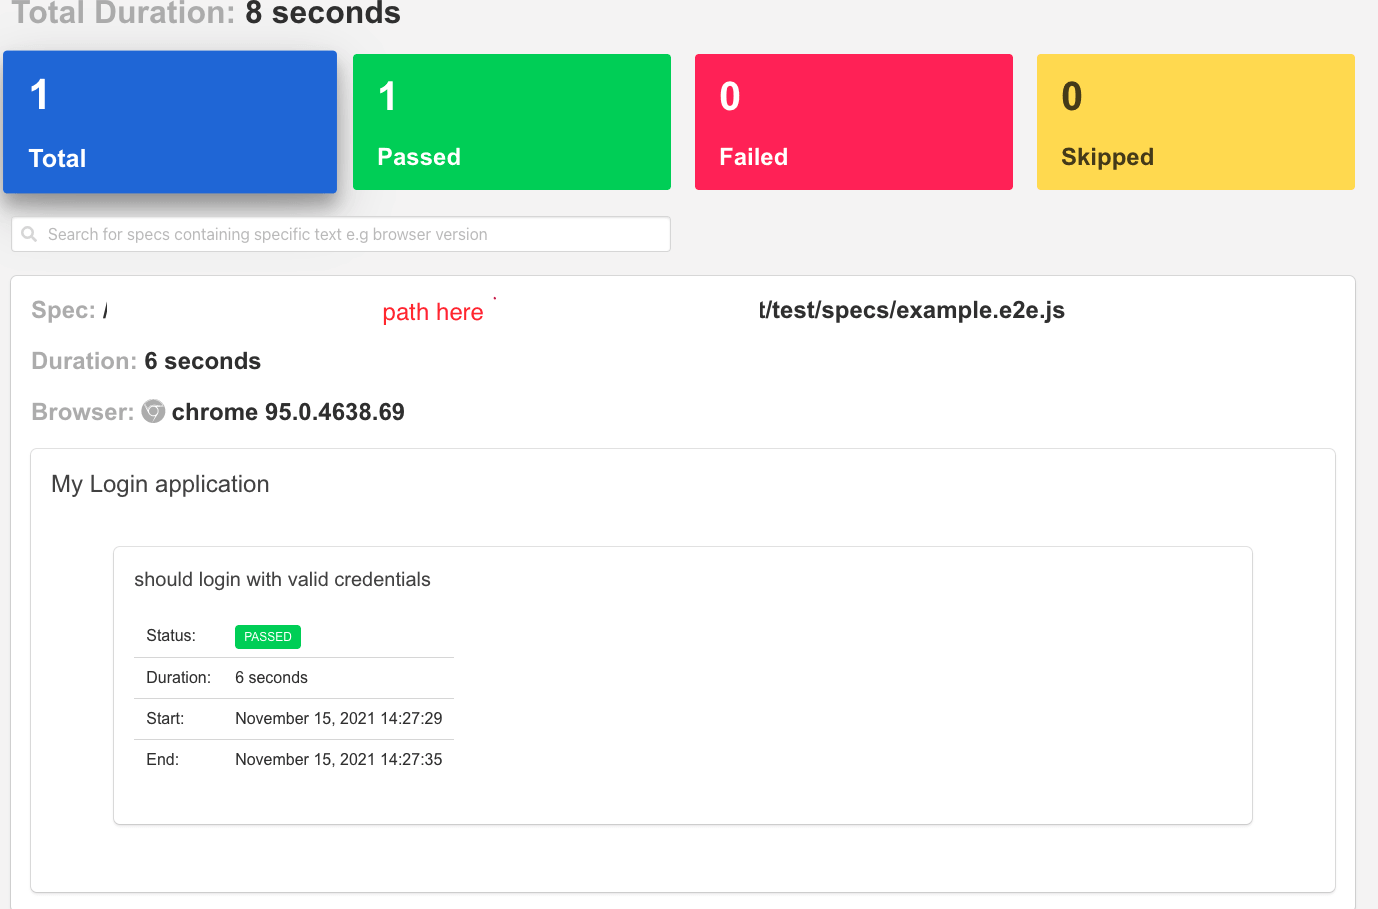
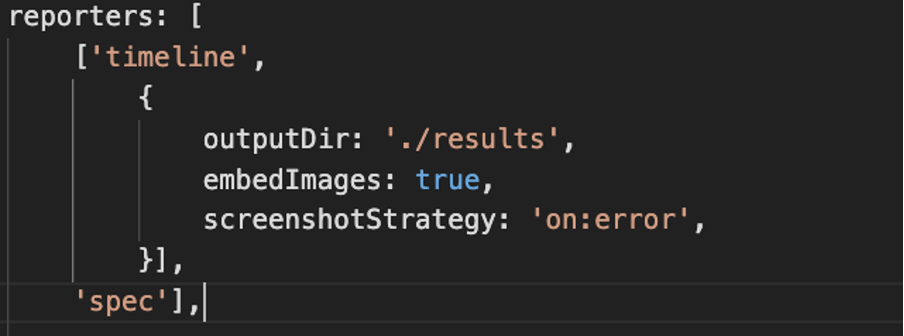
As there is no screenshot attached by default, we need to do a small config change to see the screenshots.
Now, if we run the test, we can see the report as shown below:
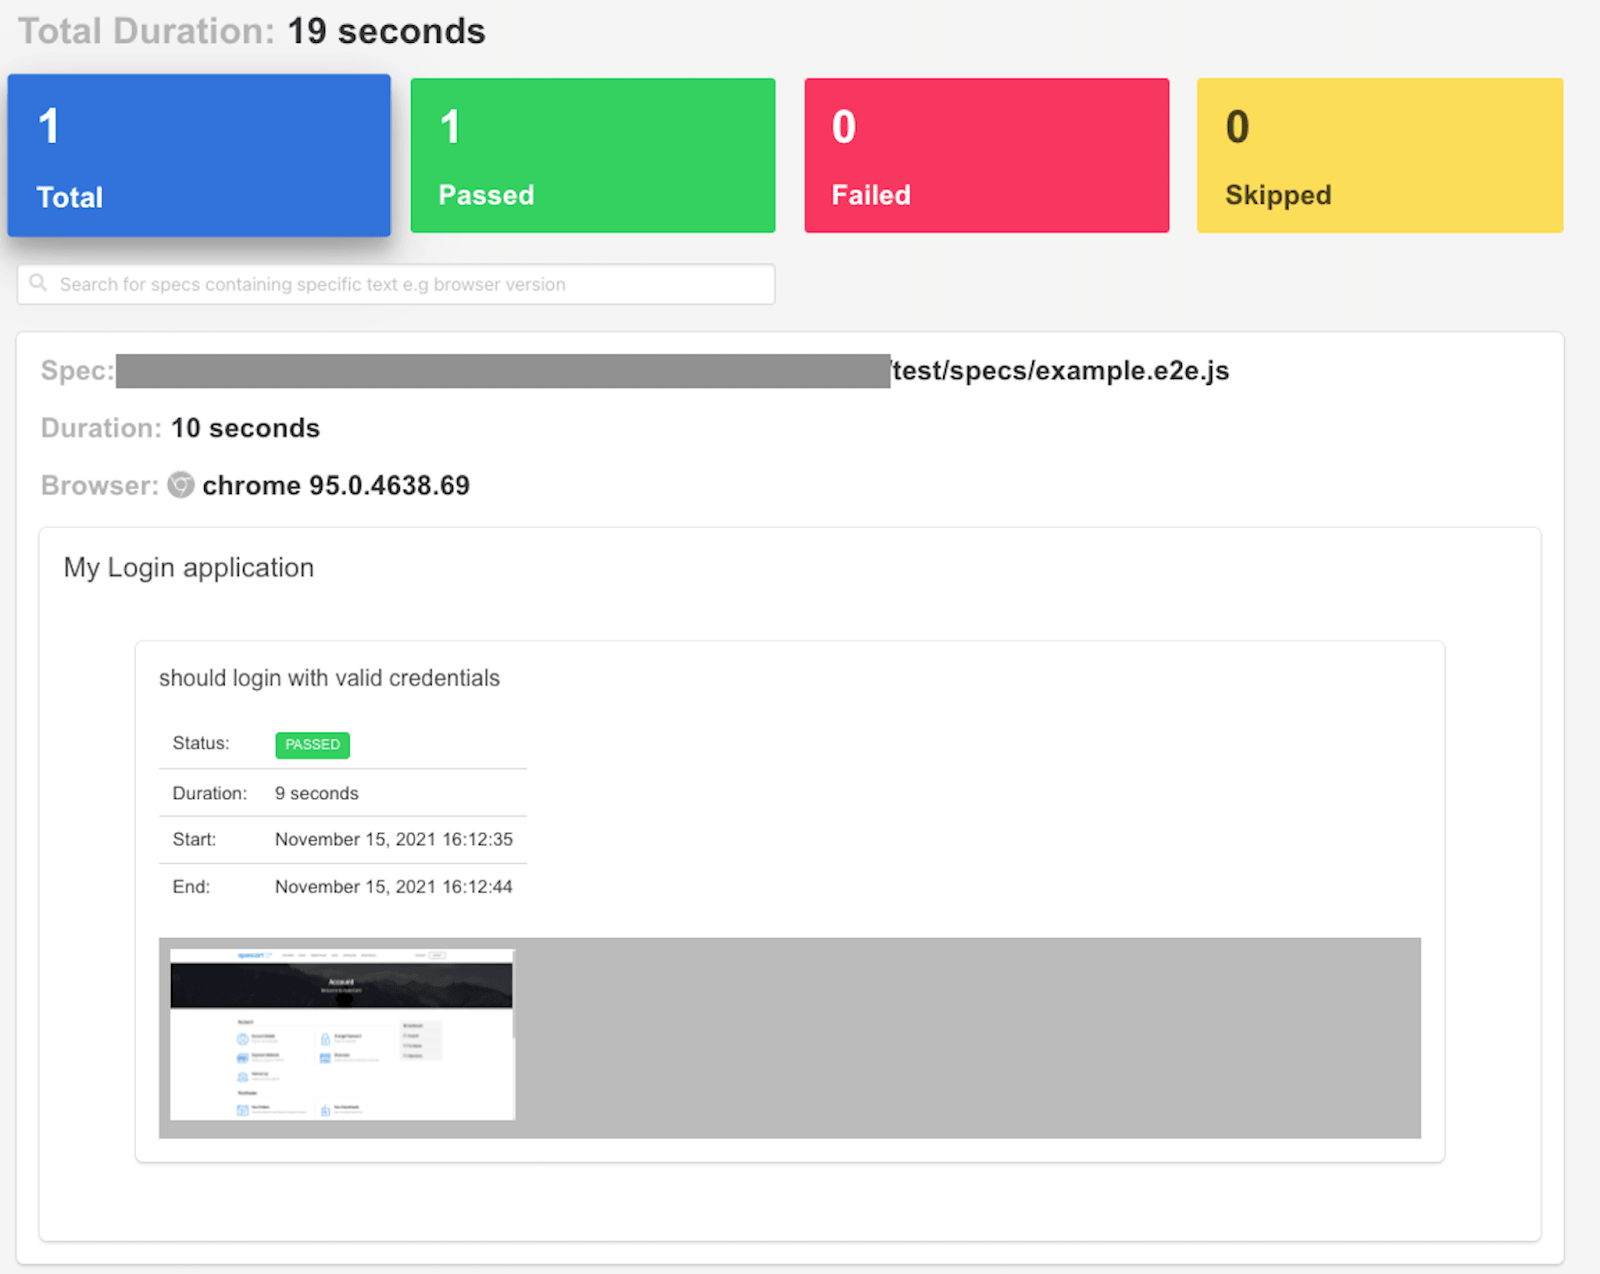
Please note here that we don’t want to call browser.takeScreenshot() in after hooks in this case as timeline reporter takes care of it internally through options embedImages and screenshotStrategy properties. However, if we use any other HTML reporting framework, we need to call browser.takeScreenshot() in after hooks.
Like we see here, a straightforward configuration, Timeline Reporter gives a very useful comprehensive HTML report.
HTML Reporter
This is another WebdriverIO HTML reporter that uses third-party packages to generate HTML reports. It provides a very detailed reporting of the test with screenshots. You can easily turn on and off the screenshots with a simple configuration from the WDIO config file. However, HTML reports will not be automatically generated unless an additional configuration is written in the event hooks of the WDIO config file (which is described in detail in the code example below).
HTML Reporter Features:
Here are some of the features of WebdriverIO HTML Reporter:
- Detailed reporting of the test with screenshots
- Error stack trace attached to test
- Post-processing is needed to aggregate test results of different suites
- Different filtering options are available to hide/unhide failed tests/suites
Let’s get it working:
HTML Reporter Installation:
To install HTML Reporter, please follow the below steps:
- Add the following dependency:
nmp i wdio-html-nice-reporter - Shown below is the snapshot of the package installation:
|
1 2 3 |
"dependencies": { "wdio-html-nice-reporter": "^7.8.7" } |
HTML Reporter Usage:
- Like what we have did for Timeline Reporter, import the dependency in wdio.conf.js
- Then add the following to “reporters” property:
|
1 |
const {ReportAggregator, HtmlReporter} = require('wdio-html-nice-reporter'); |
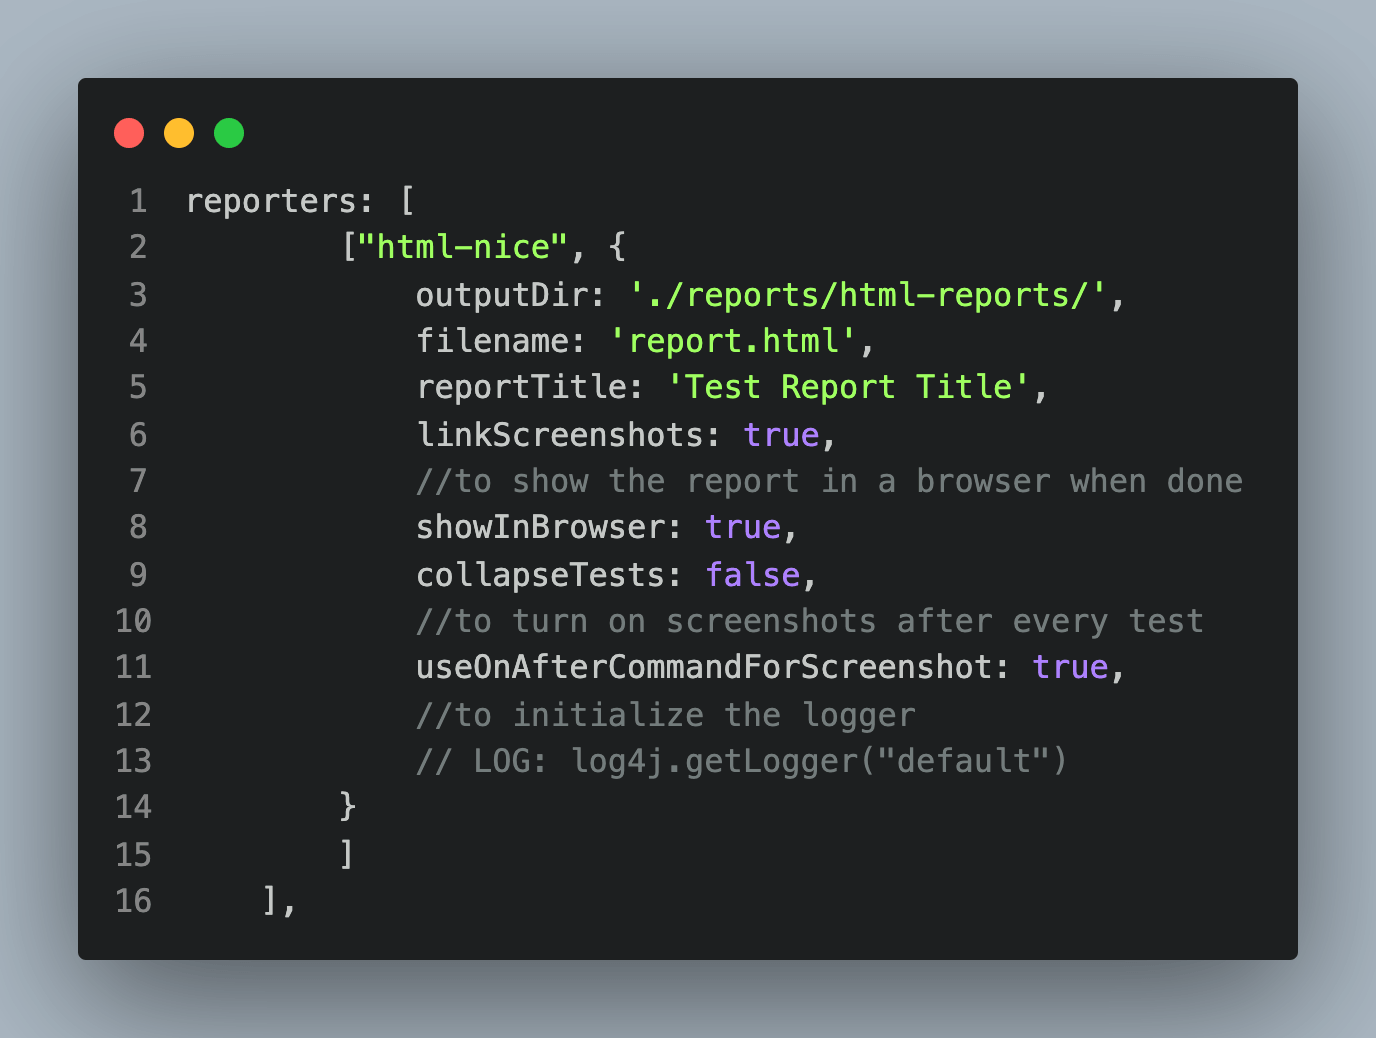
Where,
- outputDir is the path to keep the reports
- filename is the name of the report
- reportTitle is the report title (that would get displayed in the report)
- linkScreenshots: if it sets to true, screenshot will be attached to the HTML (given the takeScreenshot() method should be called in after hooks and sets in useOnAfterCommandForScreenshot to true)
WebdriverIO calls the reporter for each test suite. So, when we run multiple suits, just with the above code, we will not get an aggregated report. To get the aggregated report, we must add the following events to the WDIO config.
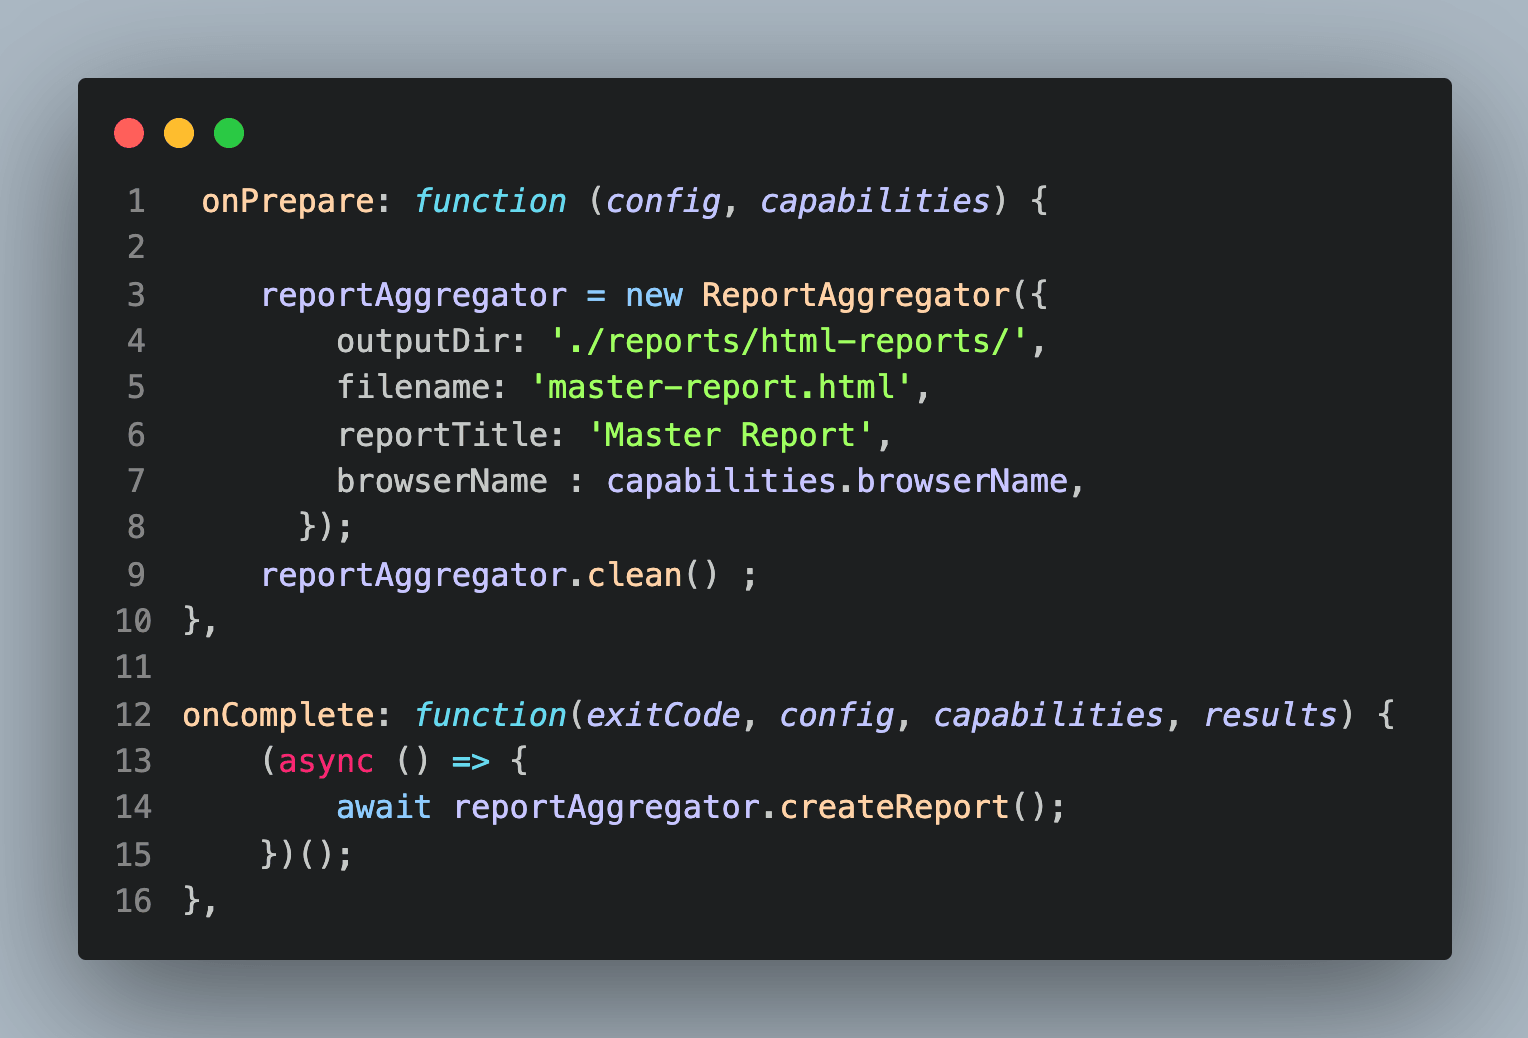
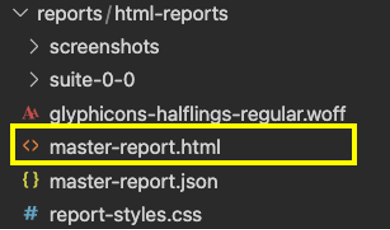
3. With all the above configurations, when we run the test, we will get a folder structure like below with a report (name can be changed in the config file):
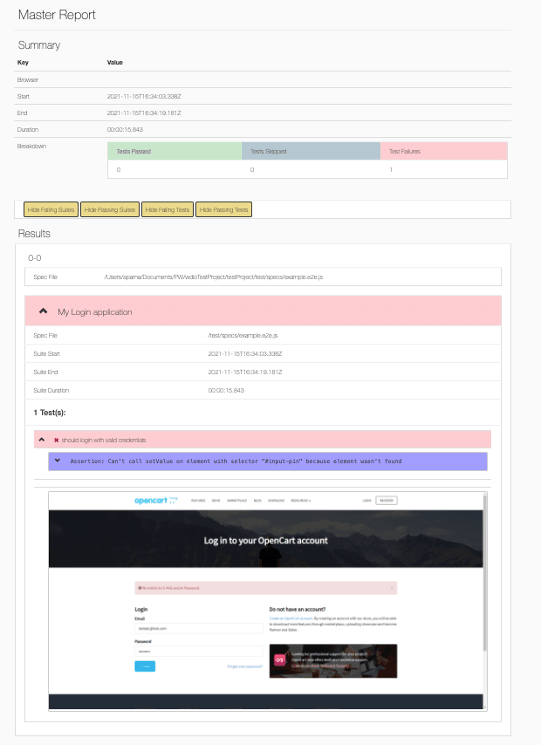
And below is the HTML report generated with screenshots for a failed scenario:
Allure Reporter
Allure reporter is one of the most used WebdriverIo HTML reporters, especially most popular with Cucumber frameworks.
Allure Reporter Features:
Here are some of the features of Allure Reporter while working with WebdriverIO:
- Allure reporter is a WebdriverIO plugin for Allure Framework
- Like any reports in the Allure framework, it generates reports in two easy steps:
- During test execution, it saves the test information in XML
- Once test execution is done, during the report generation phase, the XMLs are converted into HTML
- Jenkins plugin is available for seamless CI (Continuous Integration) experience
- Report generated with screenshots and a detailed log is also attached in the report for every action in the test
Note: Please note that Java is a prerequisite (must) to generate Allure HTML reports
Allure Reporter Installation:
To install Allure Reporter, please follow the below steps:
- Like any dependency installation, it can be done by:
npm install @wdio/allure-reporter --save-dev - Once done, package.json will have the dependency added:
|
1 2 |
"devDependencies": { "@wdio/allure-reporter": "^7.16.8", |
Allure Reporter Usage:
- Configure wdio.conf.js to use allure reports. Then, update “reporters” with allure and configure the output directory.
12345reporters: [['allure', {outputDir: 'allure-results',}]],
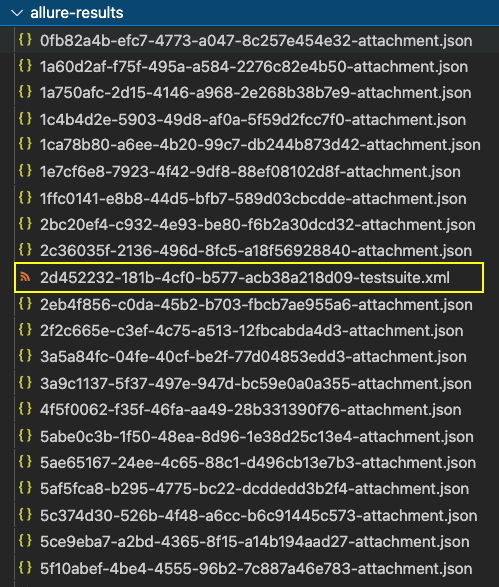
- This will generate the XML file once the test execution is done as shown below (along with multiple JSON files) at the location given in outputDir:
- Now to generate HTML from this, we need another dependency – allure-commandline that can be installed using the below command:
npm install -g allure-commandline --save-dev - Execute the below command manually:
allure generate&& allure open
e.g.: allure generate allure-results && allure open - This command will generate an HTML report and open it on the browser. And the report will be like:
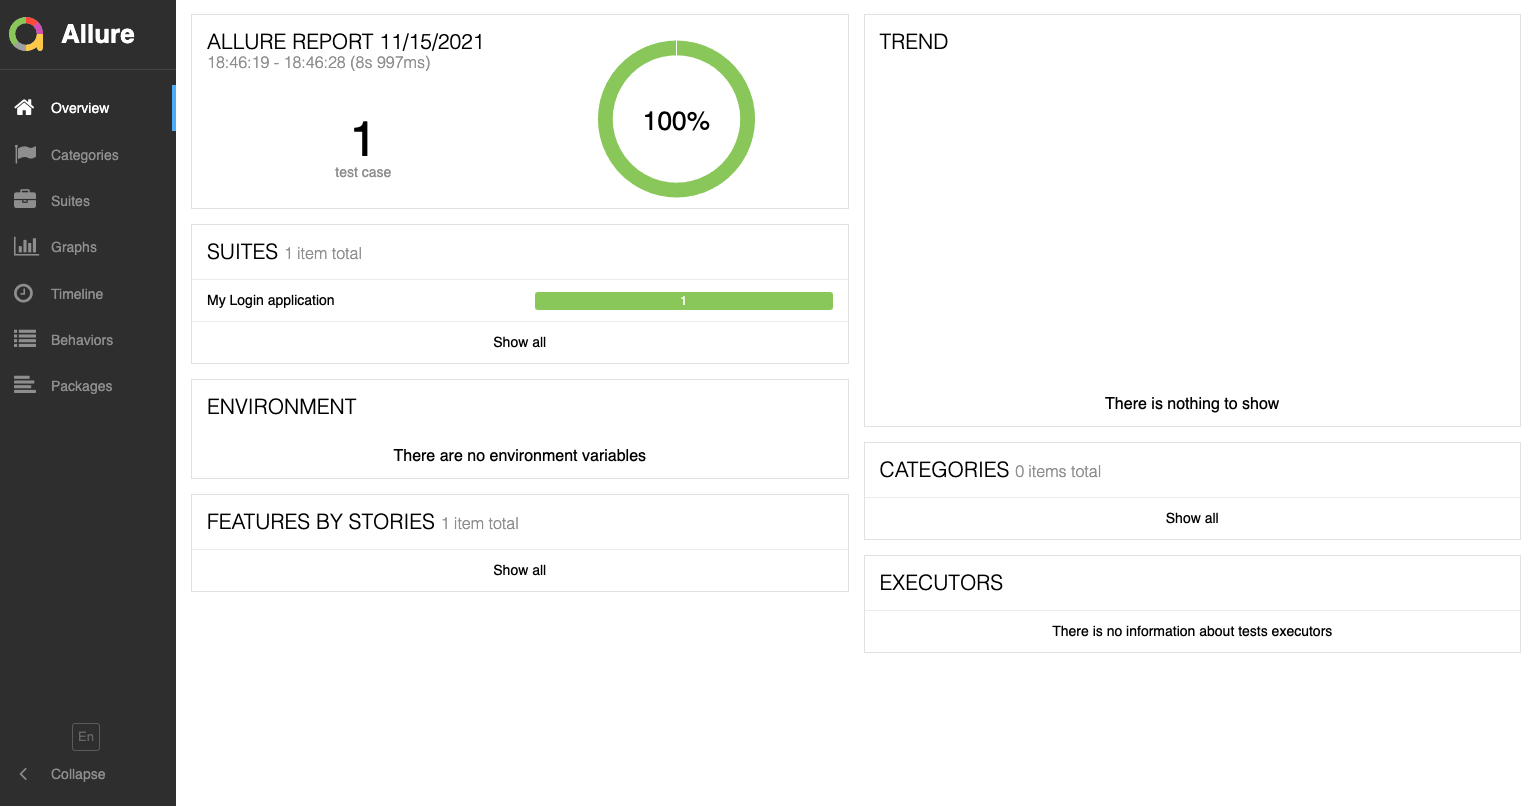
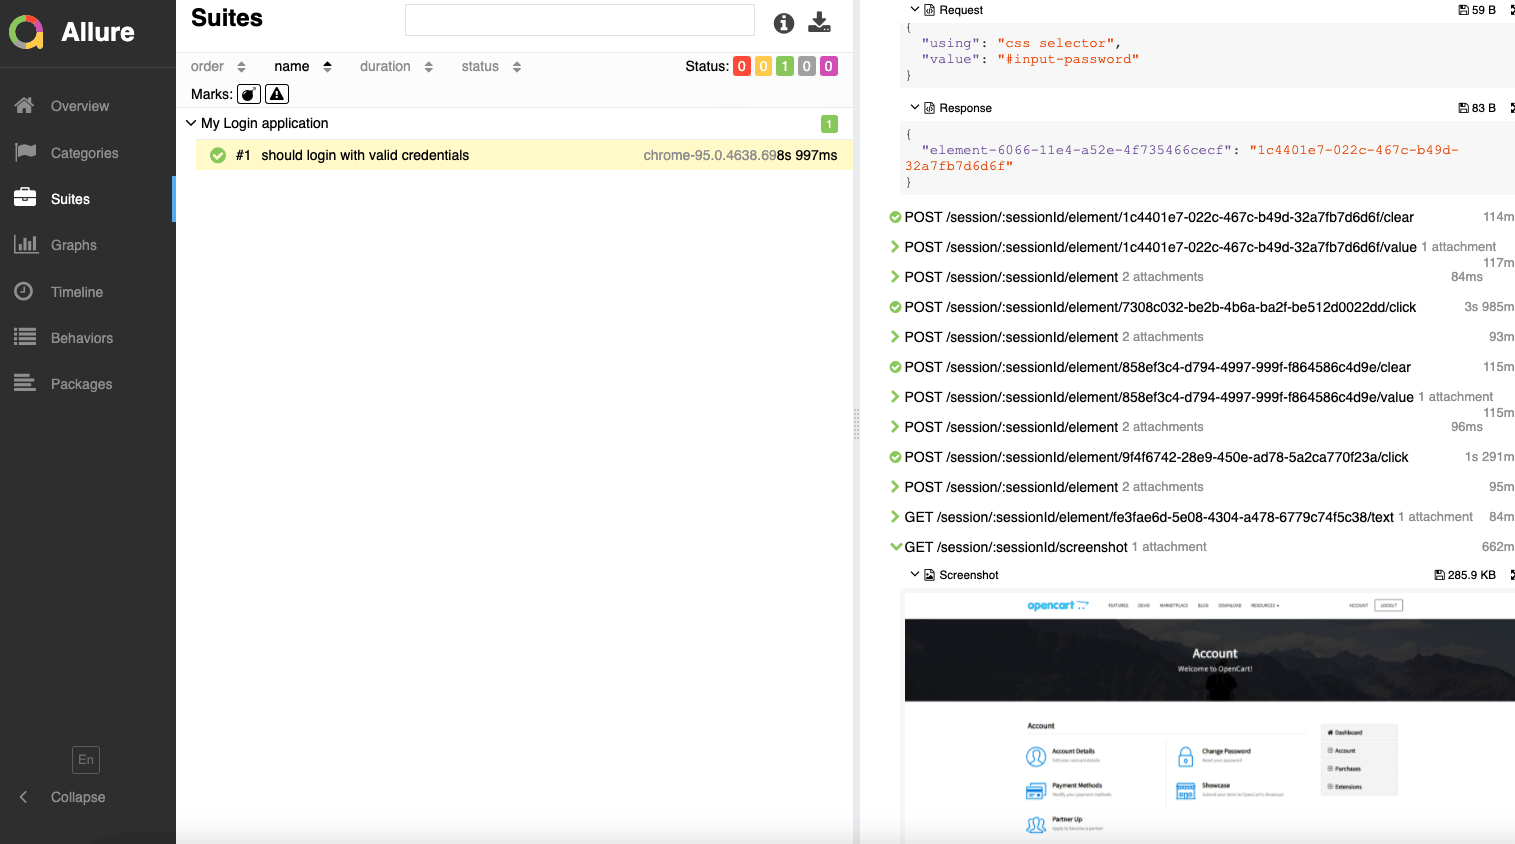
This is a very detailed report where we can see every request and response for each action in the test is captured as shown in the screenshot below:
If we have more tests and test runs, we will be able to see details in TREND. There is also a section called Graphs – where we can find more details such as the Status of the entire suite, severity, duration, duration trend, and many more details as we explore. The TREND graph is handy to monitor the stability of the tests/suites.
Conclusion
WebdriverIO has a wide variety of reporting methods, from a simple console logger to a very comprehensive HTML report. In this WebdriverIO tutorial, we have looked into various reporting methods supported by WebdriverIO. All of these WebdriverIO HTML reporters are quite popular and useful. However, the usage of these reporters is dependent on the tool stack that you use.
For example, if you are looking for a reporting library for a Mocha/Jasmine framework, I would recommend the Timeline Reporter. It’s very simple and creates a static HTML report that’s always available offline and gives all necessary information as required. Whereas for a cucumber-wdio framework, Allure is most commonly used. However, it requires an additional command to generate the HTML report (which can be configured). HTML Reporter is nice but has an additional overhead of configuration in the event hooks; however, it’s one time only.
So, looking at this, every reporter has its advantages and challenges. And the selection option comes down to the framework type and project needs. I hope you have enjoyed reading the article. Please check out the code and have fun playing with different reporting methods! You can also learn more about WebdriverIO assertions through the hub.
Happy Learning!
Frequently Asked Questions (FAQs)
What is allure in testing?
The Allure Framework allows you to create informative test reports that can be viewed and understood by testers, developers and managers. The framework is flexible and allows developers to use their preferred programming language. It supports multiple operating systems, databases, web browsers, test frameworks and CI servers.
Is allure report open source?
Yes. Allure is a lightweight, flexible, open-source multi-language test reporting tool that allows you to generate bug-free reports quickly and easily.
Which is better allure or extent report?
Compared to other reporting frameworks, Allure provides a nice dashboard and has more features baked in out of the box. This makes it much easier for you and your team to report on your automated tests.
Got Questions? Drop them on LambdaTest Community. Visit now


