19 Top UX Analytics Tools [2025]
Sachin Sharma
Posted On: February 21, 2025
![]() 101543 Views
101543 Views
![]() 12 Min Read
12 Min Read
UX analytics analyzes user interactions with digital products or services to gain insights into their behavior, preferences, and experiences. It involves collecting and analyzing data from user interactions such as clicks, taps, scrolls, and other actions to understand how users engage with a website, app, or software.
UX analytic tools help businesses understand, measure, and optimize the user experience, leading to increased customer satisfaction, higher conversion rates, and improved business performance. You can beat the competition using UX analytics tools and make intelligent decisions without guessing.
Many UX analytics tools are available to observe website traffic. In this blog, we have outlined the top 19 UX analytics tools to help you harness the power of user data and make data-informed decisions.
Basically, the UX analytics tool transforms data into actionable insights, enabling organizations to optimize the user experience, improve customer satisfaction, and achieve a better return on investment (ROI).
Let’s get to know some of the UX analytics tools in detail.
TABLE OF CONTENTS
1. Google Analytics
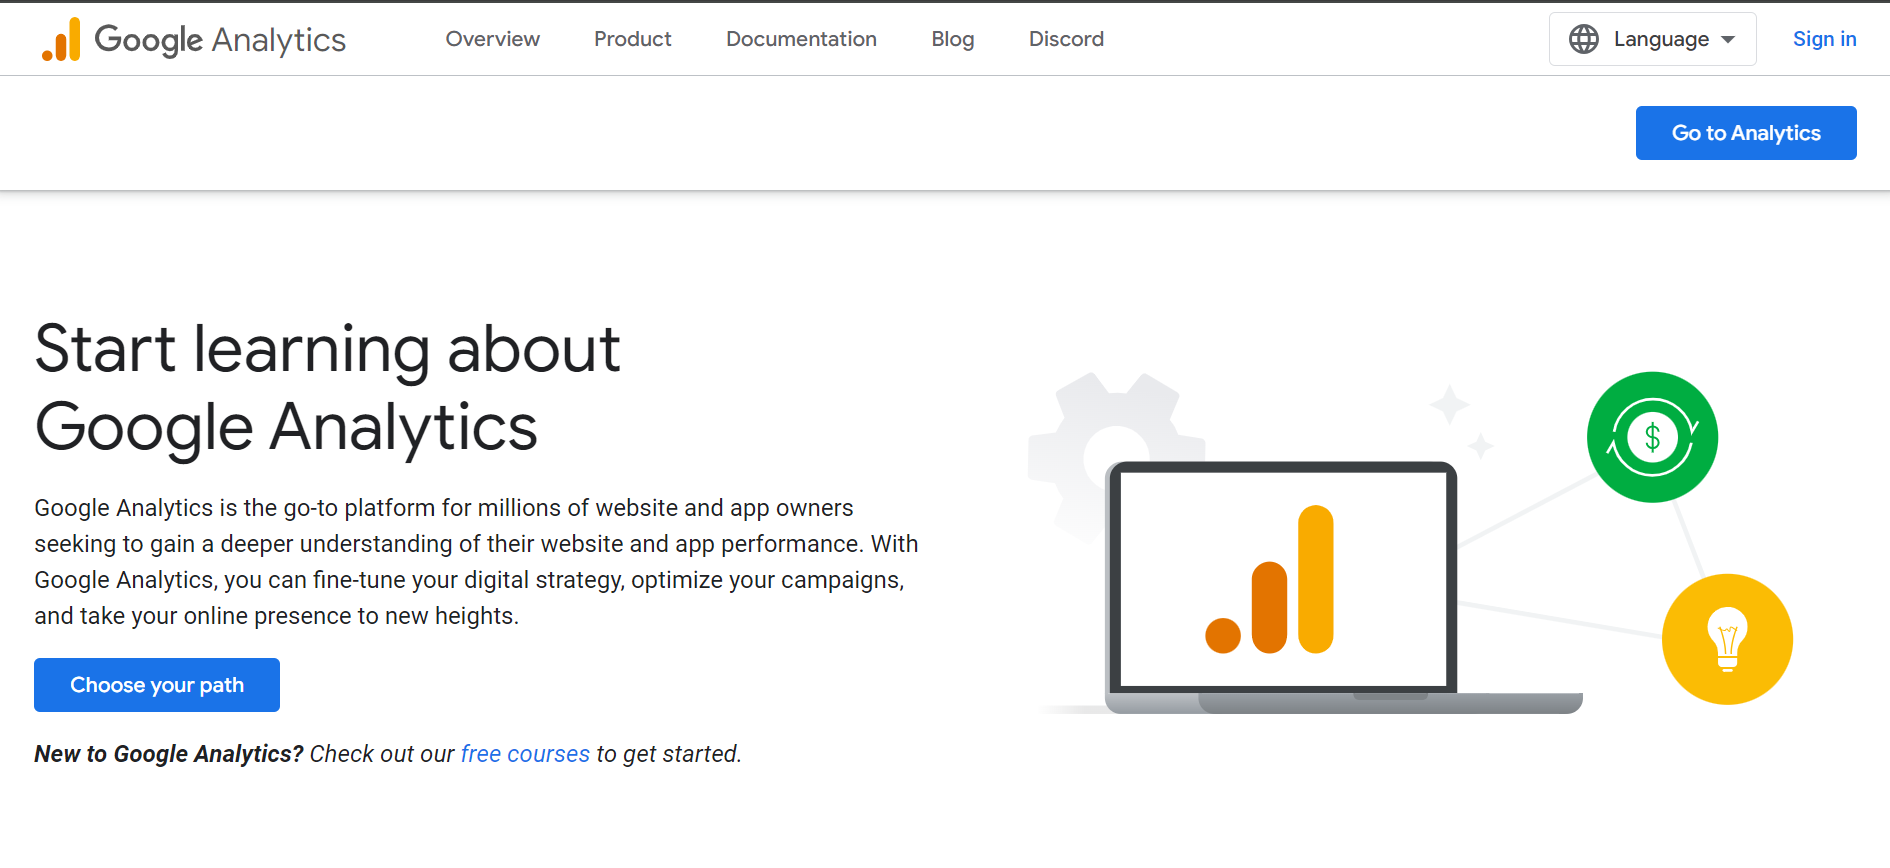
Google Analytics (GA) remains an essential UX analytics tool for digital marketers, webmasters, and UX designers looking to understand and enhance the user experience on websites and mobile apps worldwide. It is a free platform provided by Google (a paid enterprise version is also available). It offers a plethora of information on user behavior, website traffic, and conversion metrics, allowing one to gain insights into how users engage with a digital product.
How to Analyze with Google Analytics?
To use this UX analytics tool effectively for website analysis, ensure your tracking code is correctly implemented and set goals to monitor key user actions. When assessing a website’s performance, consider important metrics like sessions, bounce rate, conversion rate, and user engagement.
Utilize page view and exit page analytics to determine which content most appeals to your audience and analyze traffic sources to learn how users find your website. Utilize the Behavior Flow report to see user journeys and spot possible obstructions. Monitor conversion rates to gauge how well your website is accomplishing its goals.
Key Features of Google Analytics:
- Tracks user engagement: Session duration, pages per session, bounce rate.
- Provides traffic insights: Source of traffic (search engines, social media, direct visits).
- Real-time reporting: Active users, their locations, and current page views.
- Audience demographics: Age, gender, interests, location.
- Conversion tracking: Measures ROI of actions like purchases and form submissions.
- Custom reports and dashboards: Designed for specific business needs.
- Integration with Other Google Services: Integrates with Google Ads, Search Console, and Data Studio for comprehensive marketing and SEO strategies.
To learn more about how your users interact with your web application or web-based application, follow this guide on web analytics tools. Then, get hands-on experience with various tools that can help you improve your application’s efficiency and effectiveness based on your users’ needs.
2. Adobe Analytics

Adobe Analytics emerges as a premier solution for UX analytics. This UX analytics tool caters to enterprises seeking deep insights into customer behavior across web and mobile platforms. It provides deeper analysis capabilities than surface-level metrics, utilizing machine learning and artificial intelligence via Adobe Sensei to find subtle patterns and trends in user behavior.
How to Analyze with Adobe Analytics?
To use this UX analytics tool, you must first divide your audience into relevant groups based on their traits and behaviors. Utilize predictive analytics to project future user behavior and trends.
The Flow Analysis feature is invaluable for identifying potential areas for optimization and visualizing users’ paths through your content. The Contribution Analysis feature can also automatically identify anomalies in your data and their causes without manual research.
Key Features of Adobe Analytics:
- Real-time Data Processing: Offers insights into user behavior as it happens.
- Advanced Segmentation:Detailed breakdown of user segments based on a wide array of criteria.
- Flow Analysis: Visual pathways show how users navigate the site or app.
- Anomaly Detection: Automatically identifies data points that deviate from the norm.
- Custom Reports and Dashboards: Highly customizable reporting tools to fit specific business needs.
- Integration with Adobe Experience Cloud: Seamless integration with other Adobe products for comprehensive digital experience management.
3. Amplitude

Amplitude is a cutting-edge UX analytics tool in product analytics. It prioritizes user behavior analysis to drive product development and enhance user experience (UX). It sets itself apart by providing detailed insights into how users engage with applications, empowering teams to make defensible decisions grounded in extensive user journey data. Because of its user-centric methodology, precise segmentation, real-time analytics, and cross-platform user tracking, Amplitude is incredibly well-liked.
How to Analyze with Amplitude?
The first step in using this UX analytics tool is incorporating its SDK into your mobile or web application to gather comprehensive user interaction data. The platform excels at offering a detailed perspective of various user cohorts by segmenting users according to their actions, demographics, and other custom events.
Utilize the funnel analysis to pinpoint user journey drop-off locations and enhance conversion routes. Amplitude’s retention analysis makes understanding how feature releases and updates affect user engagement over time easier. The UX analytics tool provides various tools or services, such as behavioral cohorting and predictive analytics, to identify important factors influencing user engagement and anticipate possible churn.
Key Features of Amplitude:
- Integrates Comprehensive Data: Combines all user data for holistic behavioral analytics and AI-driven automation.
- Automated Reports for Quick Insights:Generates reliable product insights swiftly with automated reporting tools.
- Instant Visualization of User Journey: Offers immediate visualizations to help users quickly understand their path through the product.
- Real-Time Insights for All Teams:Provides every team access to precise, real-time insights, emphasizing actionable data for informed decision-making.
4. Kissmetrics
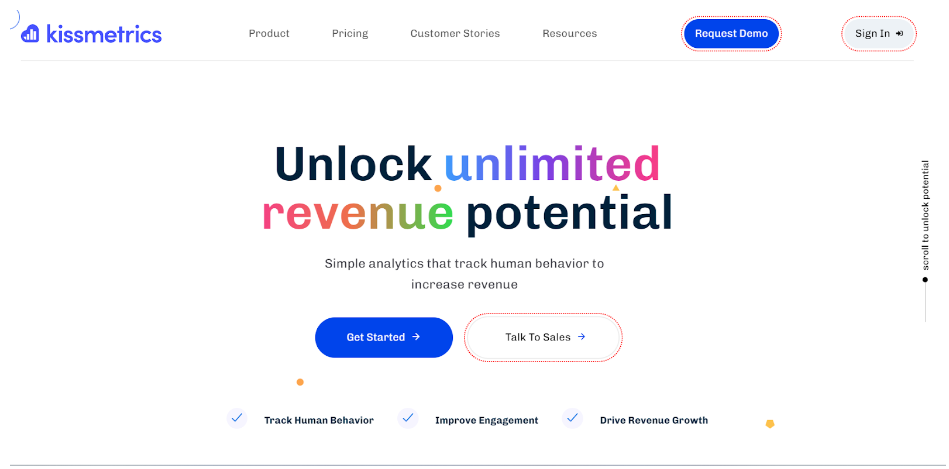
Kissmetrics is a powerful UX analytics tool, distinguished by its ability to track individual and group user behaviors across multiple devices and sessions. Designed specifically for e-commerce and digital marketing, Kissmetrics provides insight into the customer journey, facilitating personalized marketing efforts and product improvements.
How to Analyze with Kissmetrics?
Get started with this UX analytics tool by configuring Kissmetrics to track important conversion events and user interactions on your website. This tool is excellent at funnel analysis, letting you see how customers move through your website or app and pinpoint the points at which they stop using it.
Utilize cohort analysis to divide users into groups according to their demographics, behaviors, or acquisition channels. Then, monitor how these groups’ engagement and retention rates evolve. It also provides A/B testing capabilities to test and improve marketing messages or product features directly affecting user behavior.
Key Features of Kissmetrics:
- Funnel Analysis:Visualize users’ steps toward conversion and identify drop-off points.
- Cohort Analysis: Group users by behavior, acquisition source, or other custom segments to track changes over time.
- A/B Testing:Test different versions of your site to optimize for conversions.
- Email Campaign Automation: Directly engage users based on their behavior with automated, targeted email campaigns.
- Automated Reports for Quick Insights: Generates reliable product insights swiftly with automated reporting tools.
- Instant Visualization of User Journey: Offers immediate visualizations to help users quickly understand their path through the product.
- Detailed Customer Activity: Track feature usage, active users, and page views across different devices for a complete view of the customer experience.
- Advanced BI Reporting: Use SQL queries for deep data analysis, including DAU/MAU ratios and immediate post-sign-up behaviors.
Run your A/B tests on over 3000+ real environments.Try LambdaTest now!
5. Hotjar

Hotjar is a unique UX analytics tool offering qualitative and quantitative insights, enabling a holistic view of user behavior. Through heatmaps, session recordings, and surveys, Hotjar offers visual representations of user interactions in contrast to traditional analytics platforms that only focus on numerical data. Thanks to this combination, Teams can now measure user behavior and comprehend the “why” behind it.
How to Analyze with Hotjar?
To set up this UX analytics tool, you need to see where users click, navigate, and scroll on your pages before using Hotjar for UX analysis. Watch recordings of actual user sessions to spot usability problems. Use surveys and feedback polls to get first-hand feedback from users on particular features of your website or application. Integrating qualitative data analysis with quantitative metrics facilitates a more comprehensive comprehension of user behavior.
Key Features of Hotjar:
- Heatmaps: Visualize clicks, mouse movements, and scroll behavior to see what users do on your pages.
- Surveys and Feedback Polls:Gather direct user feedback to learn more about their needs and experiences./li>
- Form Analysis: Identify which fields take too long to fill out or cause users to drop off.
- Conversion Funnels: See where users are dropping off in the journey to complete a goal on your site.
- User Behavior Insights: Combine qualitative and quantitative data to understand comprehensively how users interact with your site./li>
6. UXCam
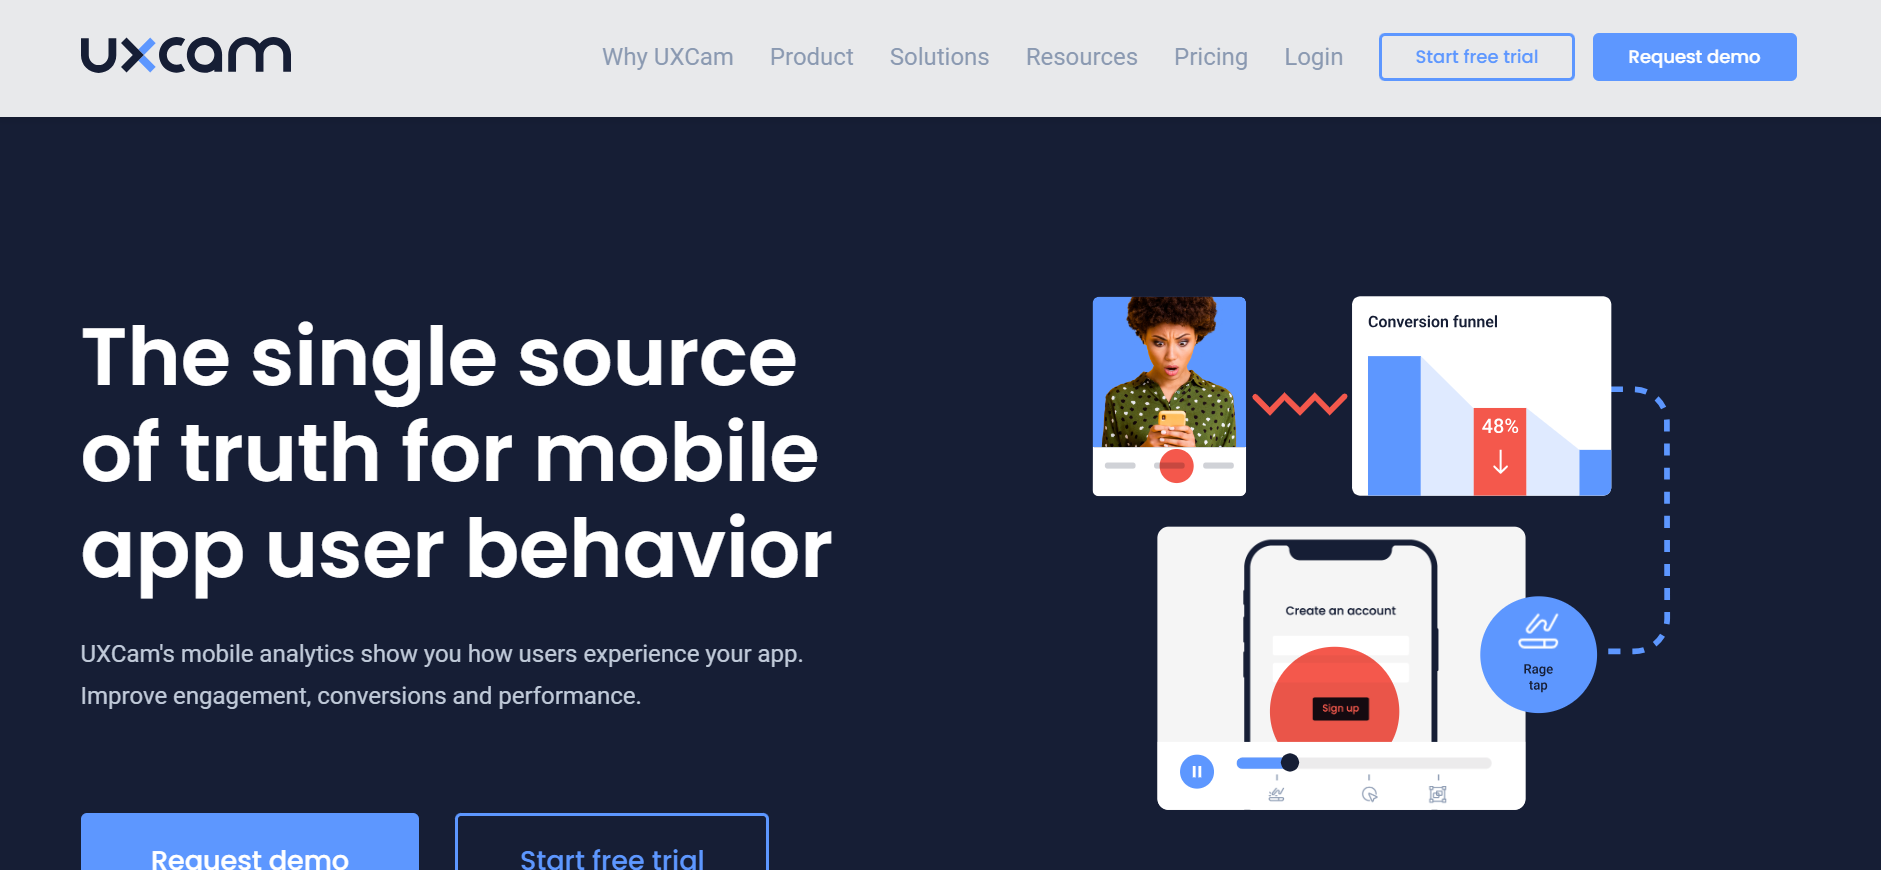
UXCam is a user experience analytics platform that offers a comprehensive suite of tools designed to help app developers, UX/UI designers, and product managers understand and enhance the user experience on mobile applications. It specializes in qualitative data analysis and provides insights through session replays, heatmaps, and user journey tracking. UXCam identifies usability issues, optimizes app performance, and improves user satisfaction by offering deep insights into how users interact with mobile apps.
How to Analyze with UXCam?
Integrate UXCam’s SDK into your mobile app to get started with this UX analytics tool. It will begin to collect comprehensive data on user interactions. Session recordings can be used to observe how users interact with your app and spot areas that need work.
Heatmaps help optimize user interface elements for better engagement by giving visual insights into where users tap, swipe, and scroll. Examine user journeys to learn about users’ routes through your app and identify trouble spots. UXCam also provides crash analytics to find and fix problems affecting app performance and stability.
Key Features of UXCam:
- Heatmaps: Visualize touch interactions (taps, swipes, scrolls) to understand user engagement with the app.
- User Journey Tracking: Map out the paths users take within the app to identify widespread flows and potential bottlenecks.
- Crash Analytics:Monitor and analyze app crashes to improve stability and user satisfaction.
- Event Tracking:Customizable event tracking to measure and analyze specific user actions.
- Real-Time Analytics:Access insights into user behavior and app performance as it happens.
- Automatic Insights:AI-driven insights to quickly identify usability issues and opportunities for improvement.
- Integration Capabilities: Seamlessly integrate with other tools and platforms for a comprehensive analytics ecosystem.
7. Contentsquare

Contentsquare is an advanced UX analytics tool and optimization platform that stands out for its deep focus on improving user experience (UX) and increasing conversion rates across web and mobile applications. It has an extensive toolkit for visualizing user interactions, analyzing consumer behavior, and finding insights that propel digital performance.
It helps businesses better understand and improve every aspect of the user journey by offering actionable recommendations to improve navigation, optimize design, and streamline content through artificial intelligence and machine learning.
How to Analyze with Contentsquare?
The first step to using this UX analytics tool is incorporating its tracking technology into your online properties. From there, it will gather extensive user behavior data. With session replays for an in-depth look at user interactions and dynamic heatmaps that monitor clicks, mouse movements, and scrolls, the platform shines at visual analytics.
Zone-based heatmaps offer a novel way to comprehend how users interact with particular page sections, allowing for more focused enhancements. Conversion funnel analysis aids in identifying drop-off points in the user journey, while automatic insights point out areas of friction and optimization opportunities. To help identify problems with navigation, Contentsquare also provides path analysis, allowing users to examine their paths.
Key Features of Contentsquare:
- Dynamic Heatmaps: Visualize user engagement with clicks, hovers, and scrolls.
- Zone-Based Heatmaps: Evaluate the performance of specific page elements.
- Automatic Insights: Leverage AI-driven analysis to identify user experience improvements.
- Conversion Funnel Analysis: Pinpoint where users drop off and uncover opportunities to increase conversions.
- Path Analysis: Discover users’ most common paths, highlighting potential navigation improvements.
- Form Analysis: Analyze user interactions with forms to reduce abandonment rates.
- Content Optimization: Gain insights into content effectiveness and user engagement.
8. Lookback

Lookback is a UX analytics tool that offers a unique set of tools for conducting live and recorded user testing sessions, making it a vital asset for UX researchers, designers, and product teams seeking to gain deep insights into user behavior and preferences. Unlike traditional analytics tools focusing on numerical data, Lookback provides a qualitative way to understand the user experience through interactive interviews, screen capture, and real-time video feedback.
How to Analyze with Lookback?
To effectively utilize this UX analytic tool, start by setting up user testing sessions that can be conducted live or recorded for later analysis. Invite participants to share their screens and use their camera and microphone to provide live feedback while interacting with your website or app. This setup is ideal for conducting usability tests, interviews, and focus groups.
Lookback’s live sessions enable real-time communication with participants, allowing researchers to ask follow-up questions and probe deeper into user thoughts and behaviors. Recorded sessions are stored for later viewing, allowing the teams to analyze user interactions and feedback conveniently.
Key Features of Lookback:
- Live Testing: Conduct live, interactive sessions with users to observe how they interact with your product in real time, enabling immediate feedback and the ability to ask follow-up questions.
- Interactive Prototypes: Test and get feedback on interactive prototypes to iterate and improve design before development.
- Collaborative Note-Taking: Enable team members to observe testing sessions and collaborate on notes in real time.
- Mobile and Web Support: Test across web and mobile platforms to understand user experiences in different contexts.
- Integration with Productivity Tools: Seamlessly integrates with tools like Slack and Jira, enhancing team workflow and communication.
Subscribe to the LambdaTest Youtube Channel to get more video tutorials on automation testing, real device testing, and more.
9. Mixpanel

The UX analytics tool provides advanced analytics for teams focused on tracking user engagement and measuring the effectiveness of product changes over time. It excels in event tracking, allowing businesses to monitor how users interact with their products closely. By analyzing users’ actions rather than just page views, Mixpanel offers profound insights into the user journey, making it a powerful tool for product and UX teams.
How to Analyze with Mixpanel?
Before you use this UX analytics tool, decide which significant events and actions you want to watch for your website or app. Determine user dropoff points and better understand the user journey by utilizing funnels. Segment users based on their behavior to identify patterns and trends. Retention analysis makes it easier to understand how changes affect user stickiness and long-term engagement. Make decisions about your product’s future iterations based on the findings of A/B testing.
Key Features of Mixpanel:
- Event Tracking: Tracks specific user actions within your app or website to give you a detailed understanding of user behavior.
- Funnel Analysis: Analyze users’ steps to complete a goal, helping identify where users drop off and how to improve conversion rates.
- Retention Analysis: Measures how often users return to your app or website, providing insights into user loyalty and engagement over time.
- User Segmentation: It allows for detailed segmentation of users based on their actions, properties, and demographics, tailoring marketing strategies and product developments.
- A/B Testing: Tests different versions of your product to see which features or changes lead to better user engagement and conversion rates.
- Automated Insights: Machine learning automatically surfaces significant trends, anomalies, and patterns in your data.
10. Mouseflow

Mouseflow is a behavior UX analytics tool that offers insights into how users interact with websites. It is a valuable resource for UX/UI designers, digital marketers, and website owners seeking to optimize the user experience and increase conversions. Mouseflow thoroughly understands user behavior, emphasizing session replay, heatmaps, funnels, form analytics, and feedback campaigns. By logging and analyzing a wide range of interactions, Mouseflow helps to identify usability issues, optimize web page layouts, and improve overall website performance.
How to Analyze with Mouseflow?
Start by adding Mouseflow’s tracking code to your website. It allows the tool to gather information about user interactions, such as mouse movements, clicks, scrolls, and form engagement. Then, watch real user journeys with session replays to spot problems and areas for improvement.
This UX analytics tool highlights high and low-activity areas to provide visual insights into user engagement. Examine conversion funnels to determine the points at which users give up on reaching a goal. Form analytics make it easier to submit forms by highlighting areas where users have difficulty.
Key Features of Mouseflow:
- Heatmaps: Aggregate user behavior into visual maps for clicks, mouse movements, scrolls, and attention.
- Conversion Funnels: Visualize the user’s path through a website and identify where users abandon the process.
- Form Analytics: Analyze user interaction with forms to identify fields that cause confusion or lead to abandonment.
- Feedback Campaigns: Collect user feedback directly through customizable surveys and polls.
- Real-Time Analytics: Access data on user behavior as it happens, allowing for immediate insights.
- Segmentation and Filtering: Drill down into specific user segments or behaviors for targeted analysis.
11. Crazy Egg
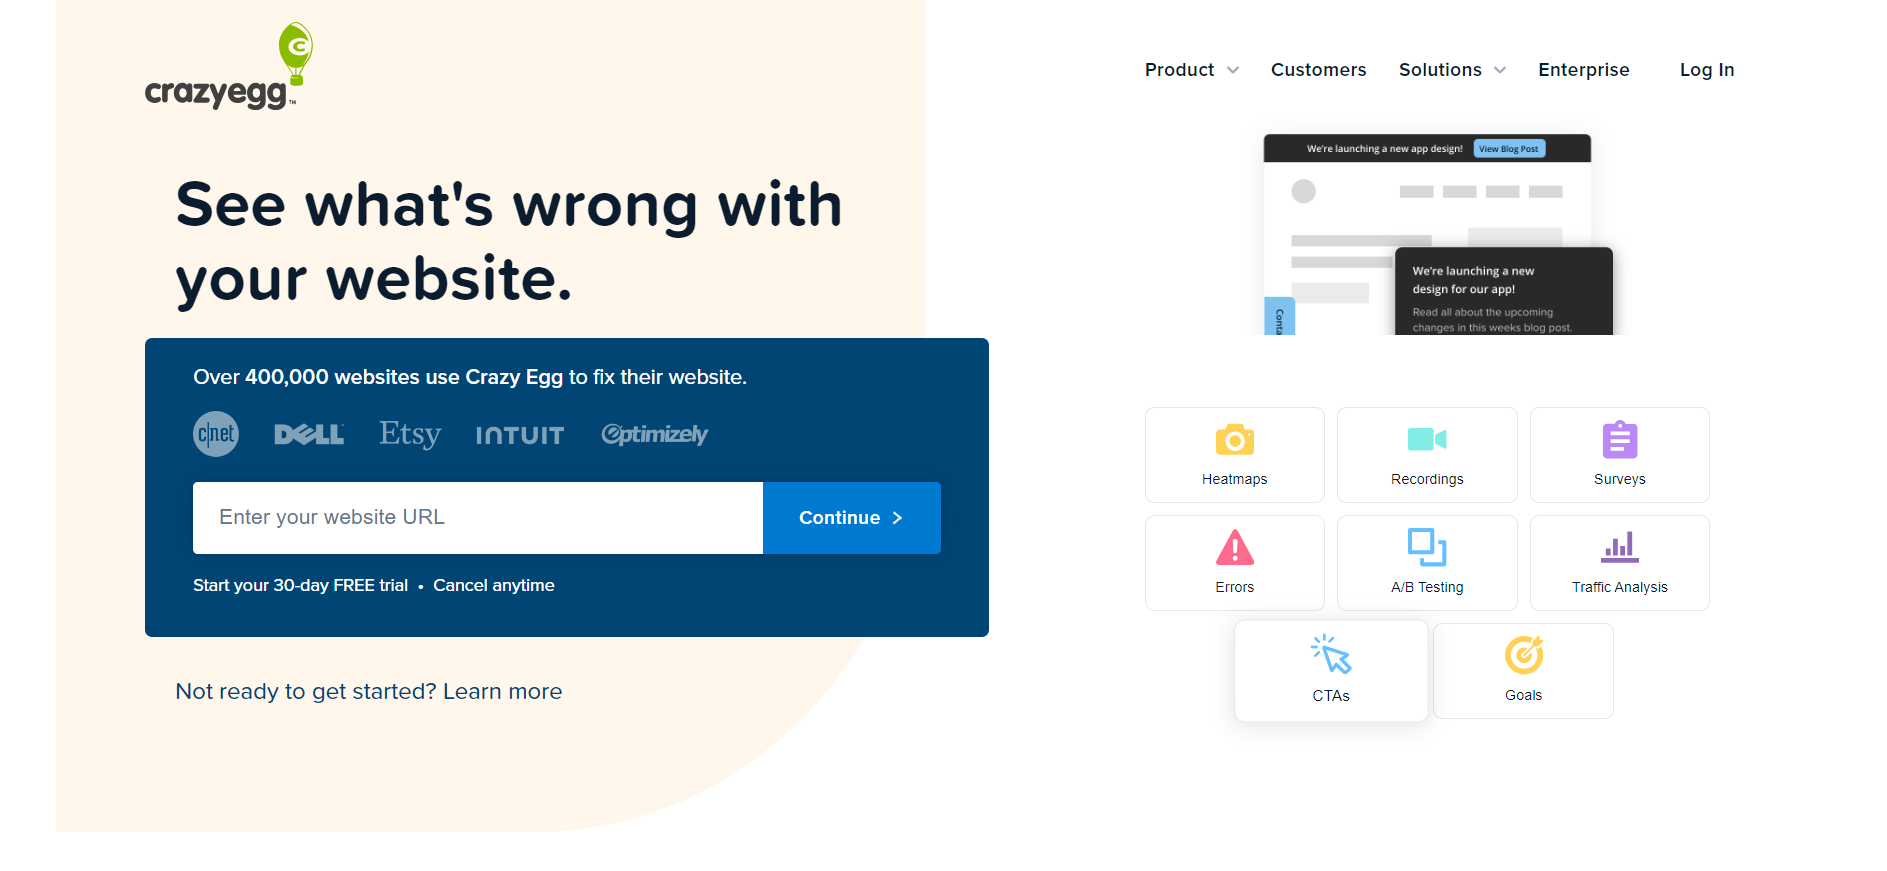
It is a popular UX analytics tool for website optimization that provides businesses with insights into user behavior through heatmaps, scroll maps, session recordings, and A/B testing. Crazy Egg is a tool that helps website owners, UX/UI designers, and digital marketers better understand how users interact with their websites.
It enables them to make data-driven decisions that improve user experience, improve website design, and boost conversion rates. With its intuitive interface and robust visualization tools, businesses of all sizes can use it to pinpoint usability problems and maximize their online presence.
How to Analyze with Crazy Egg?
Integrating this UX analytics tool with your website starts with adding a small snippet of code, after which you can immediately begin collecting data on how visitors use your site. Use heatmaps to see where users click, how far they scroll, and what grabs their attention. Scroll maps help optimize content placement by displaying the point at which users abandon a page.
Session recordings allow you to observe real visitor journeys, which can help you understand user behavior and spot potential problems. It also supports A/B testing to determine which version of your website performs better regarding user engagement and conversion—this comprehensive method of website analytics aids in identifying particular areas that require improvement.
Key Features of Crazy Egg:
- Heatmaps: Visual representation of where users click, move, and scroll on your site, providing insights into user engagement.
- A/B Testing: Test different versions of your web pages to determine which elements contribute most effectively to your conversion goals.
- Scroll Maps:This illustrates how far down users are scrolling on your pages, helping identify where content might be getting ignored.
- Confetti Tool:It provides a detailed click analysis, breaking down clicks by referral sources, search terms, and more for precise insight.
- Overlay Tool:It offers a click-by-click analysis of elements on your site to understand how different areas perform.
- List Reports:It analyzes how items on your page, like links and buttons, are performing in terms of attracting clicks.
- User Insights:It gathers direct user feedback through surveys and polls integrated directly into your site.
12. FullStory

FullStory is a UX analytics tool with extensive analytics and feedback mechanisms tailored to empower businesses to elevate their digital customer experience. Distinguished by its holistic session replay capabilities, FullStory integrates sophisticated analytics, effective conversion optimization strategies, and the distinctive feature of detecting user frustration signals.
This combination of features renders FullStory an indispensable tool for UX researchers, product managers, and digital marketers seeking to gain deep insights into user behavior, uncover pain points, and significantly improve user satisfaction across web and mobile platforms.
How to Analyze with FullStory?
Integrating FullStory into your digital platforms involves adding a code snippet to your website or mobile app. After integration, FullStory starts recording various user actions, such as page transitions, clicks, scrolls, and more, enabling in-depth session replays. These replays provide insight into the user’s experience by emphasizing problems like angry clicks, careless clicks, and frustrating moments. The analytics features in FullStory allow for segmentation and funnel analysis, which can be used to identify user drop-off points and obstacles.
Key Features of FullStory:
- Rage Clicks, Error Clicks, and Dead Clicks Tracking: This feature automatically detects signs of user frustration and confusing site areas.
- Funnel Analysis: Visualize the user journey and identify where users drop off or convert, allowing for targeted improvements.
- Segmentation and Filtering: Analyze user behavior by segmenting users based on actions, geography, device, etc.
- Custom Event Tracking: Track specific interactions or milestones within your site or app for deeper insights.
- Real-Time Dashboards: Monitor user behavior and site performance through customizable dashboards.
- Heatmaps: Visualize where users click, move, and scroll on your pages for additional insights into user engagement.
- Page Insights: Automatically surfaces critical insights about page performance and user interaction patterns, assisting in prioritizing website improvements.
13. Optimizely

Optimizely is a leading experimentation UX analytics tool that empowers businesses to conduct A/B testing, multivariate testing, and personalization strategies at scale. It’s designed to help marketing teams, product managers, and UX designers make data-driven decisions by testing different versions of their web pages, mobile apps, and backend algorithms. Optimizely facilitates an iterative approach to improving user experience, increasing engagement, and boosting conversion rates by enabling companies to experiment across their digital touchpoints.
How to Analyze with Optimizely?
Integrate Optimizely’s code snippet or SDK into your digital product to get started. This lets you set up various tests, such as A/B tests, where you show two different versions of a page to different groups of visitors, or more detailed tests that simultaneously look at the effects of many changes. With Optimizely, you can also make the user experience more personal by grouping users based on their actions, where they come from, and other details. The results of these tests are shown on easy-to-understand dashboards that update in real-time, giving you immediate insight into important measures like how many users are converting and how engaged they are.
Key Features of Optimizely:
- A/B Testing: Compare two versions of a web page or app feature to determine which performs better.
- Multivariate Testing: Test multiple variations simultaneously to understand how different elements interact.
- Personalization: Tailor digital experiences to individual user segments based on their behavior, preferences, and data.
- Feature Flagging: Safely roll out new features to a subset of users to test the impact before a full launch.
- Experimentation Program Management: Manage and track the progress of multiple experiments from a centralized dashboard.
- Audience Targeting: Create detailed segments for experimentation based on user data and behavior.
- Integration Capabilities: Seamlessly integrate with analytics, data management platforms, and marketing tools to enhance data insight and actionability.
14. VWO
VWO (Visual Website Optimizer) is a comprehensive A/B testing and conversion optimization platform that enables businesses to experiment with different website versions to identify what works best for their audience. It’s designed for marketers, product managers, and UX designers who aim to enhance user experience, increase conversion rates, and make data-driven decisions. VWO provides tools for A/B testing, multivariate testing, split URL testing, personalization, and more, making it a versatile choice for optimizing digital experiences.
How to Analyze with VWO?
Start with A/B testing to compare different versions of your web pages or split URL testing for more substantial changes hosted on separate URLs. Using VWO in multivariate testing makes understanding how various elements interact easier. Use the platform’s personalization features to target different audience segments with content based on their preferences, behavior, or demographics.
It offers heatmaps, session recordings, and quantitative data acquired from experiments to facilitate a qualitative understanding of user behavior. The platform’s analytics dashboard, which comprehensively reports experiment results, allows you to choose how to optimize your website.
Key Features of VWO:
- A/B Testing: Experiment with two or more page variations to see which performs better
- Multivariate Testing: Test multiple variables simultaneously to analyze the effect of each component.
- Split URL Testing: Compare different web page versions hosted on separate URLs.
- Personalization: Customize user experiences based on visitor behavior, location, or device type.
- Heatmaps and Session Recordings: Visualize user activity and replay user sessions to identify usability issues.
- Form Analytics: Analyze form submission behavior to identify fields that cause user drop-offs.
- Surveys and Feedback Tools: Directly gather user feedback to understand user needs and experiences.
- Goals and Funnels Analysis: Set conversion goals and analyze user paths to optimize the conversion funnel.
15. UserTesting

UserTesting allows you to gain detailed human insights to better understand your customers. It also allows you to test websites, apps, and prototypes with real users to gather feedback and improve the user experience.
How to Analyze with UserTesting?
This UX analytics tool involves reviewing and organizing feedback to identify patterns and prioritize issues based on frequency, severity, and impact. It lets you share insights with relevant stakeholders, product managers, designers, and developers. With this detailed insight, you can improve your product and then test it again with users.
Key Features of UserTesting:
- Create Actionable Insights:You can use user feedback to create actionable insights.
- Prioritize Issues: You can prioritize issues based on frequency, severity, and impact on user experience.
- Identify Patterns: It helps you identify and highlight the patterns that need improvements.
16. Lucky Orange
Lucky Orange is a UX analytics tool that provides various features to help you analyze user behavior on your website. One key feature of this UX analytics tool is the ability to view real-time data, such as how many people are currently on your site, where they are located, and what pages they view. It has session recordings, allowing you to watch individual user session recordings to help you understand the user’s activities and help identify usability issues.
How to Analyze with Lucky Orange?
First, after setting up the tracking code and landing on the dashboard, you can view the real-time data to see what visitors are doing at that very moment. You can also look into heatmaps to see where users click, scroll, and wave their mouse around your site.
Follow user journeys through conversion funnels to trace the steps leading them to critical actions like making purchases or signing up, then fine-tune these routes for better outcomes. Scrutinize form analytics to boost completion rates by pinpointing and ironing out any rough spots that might deter users. Lastly, polls and surveys can be used to gather visitor feedback to grasp their desires and preferences better. By embracing these strategies, you will pave the way for a nuanced understanding of user behavior while enhancing your website’s performance and overall user experience.
Key Features of Lucky Orange:
- View Real-time Data: It allows you to view real-time data, such as the number of users visited, who is currently on your site, where they are located, and what pages they view.
- Form Analytics: It provides form analytics that can help you identify which fields are causing users to abandon the form and optimize it for better conversions.
- User Feedback: It allows you to create polls and surveys to gather feedback from your website visitors
17. Clicky
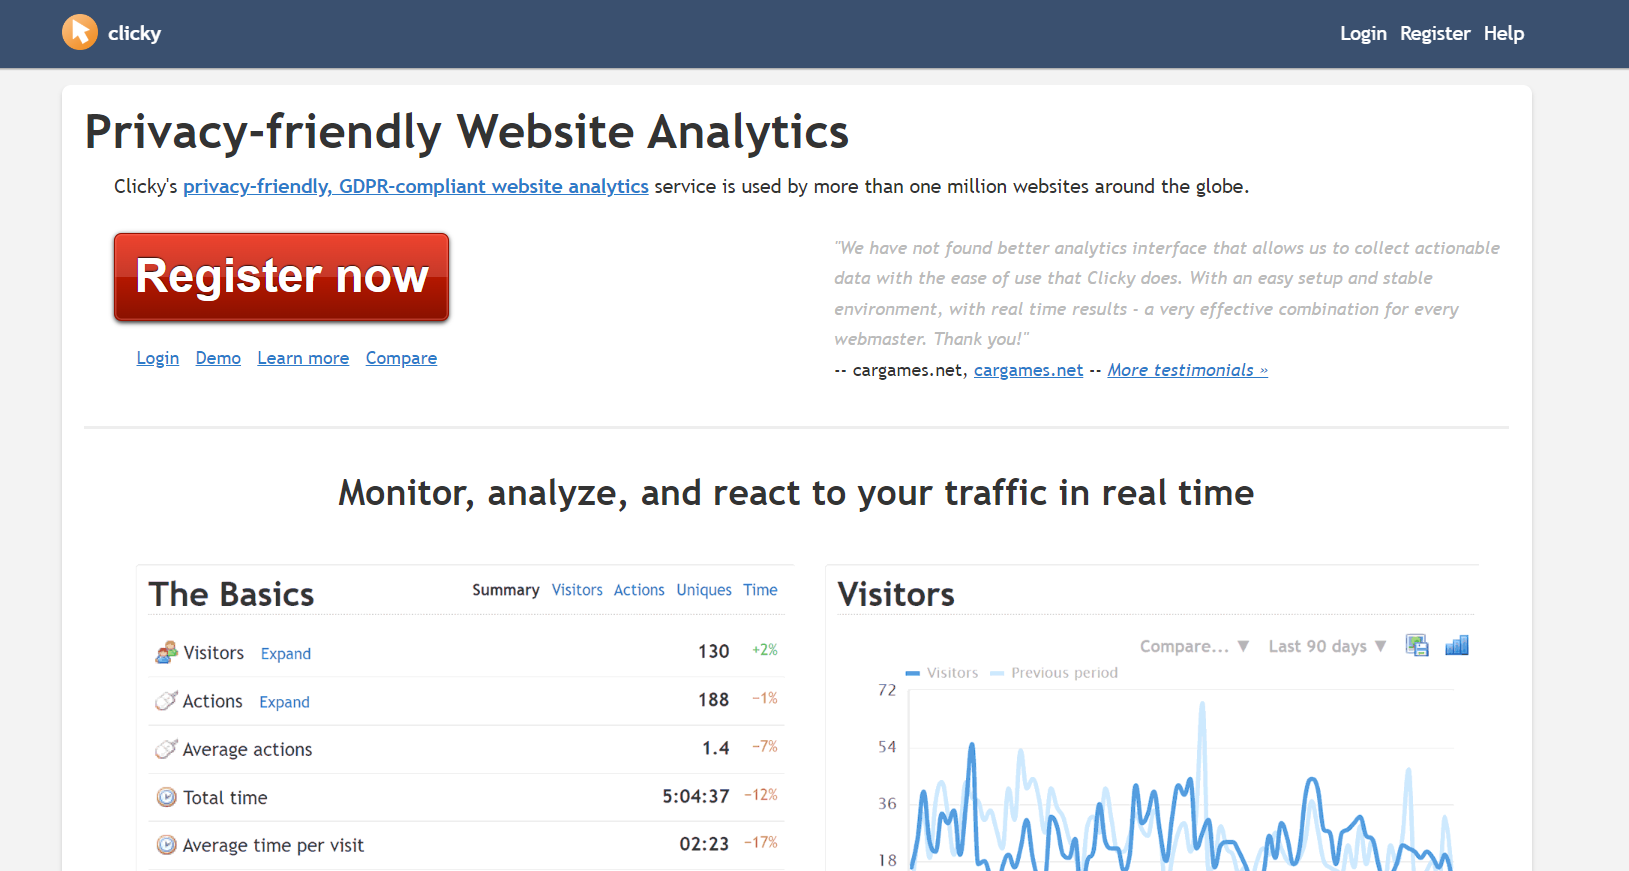
Clicky is a real-time UX analytics tool whose professional, intuitive, and user-friendly look will make you use it repeatedly to analyze your website. It provides real-time and expanded user details, making it even more sophisticated.
How to Analyze with Clicky?
To analyze data using this UX analytics tool, you must first access the dashboard to view real-time analytics data that will help you understand current visitor activity. You can use the spy feature to see live sessions and understand navigation patterns. With this UX analytics tool, you can track goals to measure specific user actions that will further help you assess your website’s effectiveness. You can also review detailed reports on traffic sources, demographics, and behavior to gain insights into your audience.
Key Features of Clicky:
- Real-time Analytics: Get real-time data on visitor activity, including current visitors, pages viewed, and more.
- Heatmaps: Visualize how users are interacting with the website, such as user clicks, mouse movements, and scrolling behavior on your website, to identify the areas that need more improvement.
- Spy:It provides the view of live sessions of users to help you understand how users navigate your site.
- Uptime Monitoring: It ensures that your website’s uptime and performance are always accessible to visitors.
- Custom Dashboards: You can create custom dashboards to track the metrics that matter most to your business.
- API Access: You can integrate Clicky data with other API tools.
18. Flink
The Apache Organization provides this UX analytics tool for real-time streaming data. It’s scalable to 1000 nodes with low latency and high-level performance. It also offers event-time processing and helps in state management.
How to Analyze with Flink?
To use this UX analytics tool, you must first configure Flink clusters to handle your data processing. You can use Flink’s APIs and libraries to transform, filter, aggregate, and analyze the process data in real-time or in batches to understand user engagement better. It monitors your Flink jobs to ensure they are running efficiently and troubleshoot any issues that arise. This Flink jobs data lets you make data-driven decisions on how to effectively improve the performance of your website and how to deal with low-latency processing, fault tolerance, and exactly-once semantics.
Key Features of Flink:
- Low Latency:It can process data at very low latency, making it an ideal analytic tool for real-time or near-real-time processing.
- High Throughput: It can handle high-volume data and process it efficiently, better used for large-scale data processing tasks.
- Fault Tolerance: It ensures data is processed correctly, even during failures.
- Dynamic Scaling: It dynamically scales its resources based on workload, allowing it to handle various data loads smoothly.
19. Inspectlet
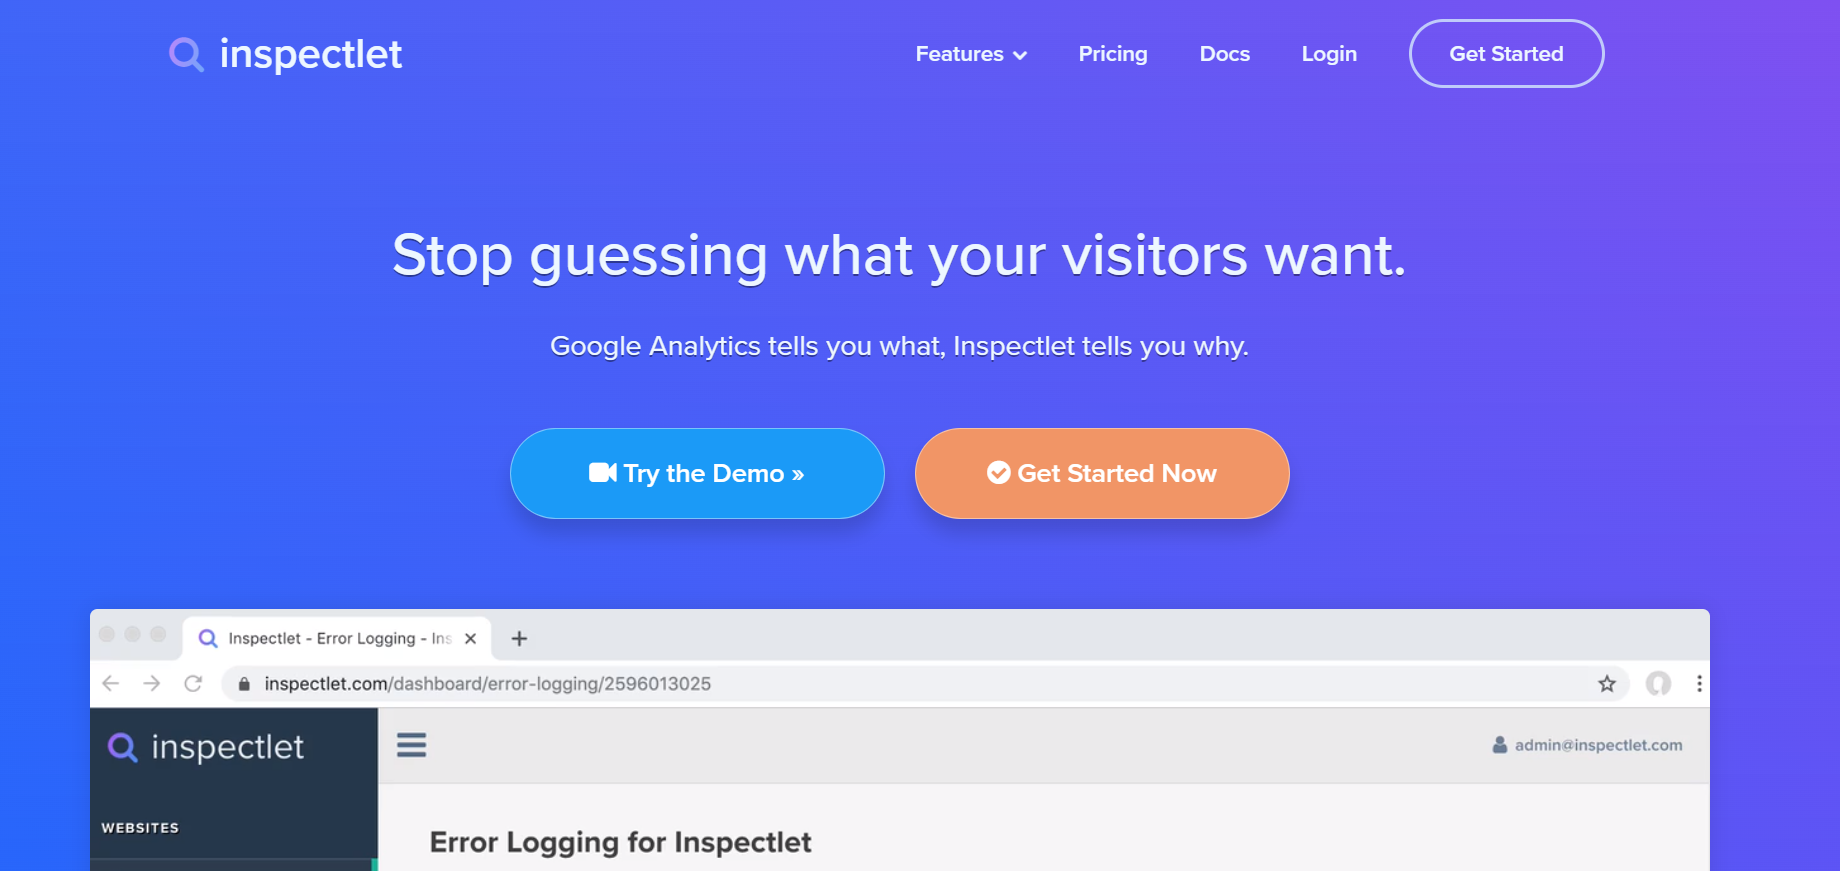
This UX analytics tool helps you understand the actual activity of the user on your website. It records a video of the user’s complete activity. It’s like a Session Recording. It lets you know what your user is looking for/navigating your site for.
How to Analyze with Inspectlet?
To use this UX analytics tool, you can access the dashboard for various analytics features, such as session recordings. These will allow you to watch how users interact with your site and help identify areas for improvement and usability issues. By using inspect lets filtering and other tools, you can drill down into specific users’ data and behavior patterns and use detailed reports to make informed decisions about your website’s design, content, and user experience.
Key Features of Inspectlet:
- Form Analytics: It helps you track how users interact with the forms on your site.
- Filtering and Segmentation: This advanced filtering and segmentation tool lets you analyze specific user behavior patterns.
- Conversion Funnels: It helps you manage conversion funnels, showing how users move through your site and where they drop off.
- API Access: It allows you to integrate Inspectlet data with other tools and services using their API.
- Customizable Reporting: It helps you create custom reports that track the metrics important for your website’s performance and business.
With all the tools mentioned above, user experience and engagement play an important role. Hence, building software applications with smooth UI/UX is crucial, and validating the functionality and appearance of your website becomes paramount.
To ensure a better UX, it’s also important to perform UX testing to check the functionality and appearance of your software application so that users can interact. To ensure the correct working of your software application, you can use a cloud-based platform like LamdbaTest.
LambdaTest is an AI-native test orchestration and execution platform that lets you run manual and automated UI/UX tests at scale with over 10,000+ real devices, browsers, and OS combinations.
100+ Free Online Tools From LambdaTest!
LambdaTest has come up with an index of 100+ free online tools for developers and testers. From HTML, XML, and JSON formatters to robust data generators, and hash calculators. LambdaTest’s free online tools are built to help engineering teams accelerate and be more productive with their daily activities.
Code Tidy
- JSON Prettify
- JSON Minify
- HTML Prettify
- HTML Minify
- JavaScript Minify
- CSS Minify
- CSS Prettify
- XML Minify
- XML Prettify
Data Format
- IDN Encode
- IDN Decode
- XML to JSON Converter
- JSON to XML Converter
- BCD to Decimal
- HEX to Decimal
- Decimal to BCD
- UTF8 Decode
- UTF8 Encode
- HEX to RGB Converter
- RGB to HEX Converter
- HTML to Markdown Converter
- Markdown to HTML Converter
- Decimal to Gray Code Converter
- Gray Code to Decimal
- URL Decode
- URL Encode
- Base64 Encode
- Base64 Decode
- Text to HTML Entities Converter
- HTML Entities to Text Converter
Random Data
- Random JSON Generator
- Random XML Generator
- Random CSV Generator
- Random YAML Generator
- Placeholder Image Generator
- Random Binary Generator
- Random Character Generator
- Random Color Generator
- Random Date Generator
- Random Decimal Fraction Generator
- Random Decimal Generator
- Random GUID Generator
- Random HEX Generator
- Random Octal Generator
- Random IP Generator
- Random MAC Generator
- Random Number Generator
- Random Paragraph Generator
- Random Password Generator
- Random Time Generator
- Random UUID Generator
- Random Sentence Generator
- Random String Generator
- Random Word Generator
- Random Data from RegEXP
- Test Data Generator
- Lorem Ipsum Generator
- Credit Card Number Generator
- QR Code Generator
- Random Byte Generator
Security Tools
- Hash Calculator
- Hash MAC Generator
- CRC32 Hash Calculator
- CRC32B Hash Calculator
- Ripe MD 128 Hash Calculator
- Ripe MD 160 Hash Calculator
- Ripe MD 256 Hash Calculator
- Ripe MD 320 Hash Calculator
- MD2 Hash Calculator
- MD4 Hash Calculator
- Adler32 Hash Calculator
- Gost Hash Calculator
- Whirlpool Hash Calculator
- MD5 Hash Calculator
- SHA1 Hash Calculator
- SHA256 Hash Calculator
- SHA384 Hash Calculator
- SHA512 Hash Calculator
Utils
- Find and Replace String
- HTML Escape
- HTML Unescape
- Difference Checker
- Shuffle Letters
- Shuffle Text Lines
- Sorting List
- Split Your String
- Text Lowercase
- Text Uppercase
- Text Repeater
- Text Rotator
- Character Count
- Word Count
- Lines Count
- Sentence Count
- URL Parse
- JSON Escape
- JSON Unescape
- Extract Text from HTML
- Extract Text from JSON
- Extract Text from XML
- Strip HTML
- JSON Validator
Got Questions? Drop them on LambdaTest Community. Visit now


