5 Top Practices For Debugging [2024]
Saif Sadiq
Posted On: March 7, 2024
![]() 23555 Views
23555 Views
![]() 6 Min Read
6 Min Read
Coding is fun and easy. But, not always.
Well, when does it stop being fun actually? It stops being that fun when you accidentally come across something called as an ‘error’.
All of a sudden, the world starts looking like a dark hopeless tunnel and from code your focus shifts towards the ‘bug’ which crept into your code under your nose. The size, application, and features of a program are inversely proportional to the developer’s capability of interpreting the errors by herself.
However, the world of coding is not that gloomy. If you are well-versed with the language and some debugging tools, debugging the code is not that difficult. Following some tips and tricks, you can easily cross the river without being bitten by the ‘bug’
Here, we have brought you top five practices for debugging websites issues in general –
Syntax May Be The Culprit
As compared to logical errors, syntactical errors are found in abundance in any piece of code. Missed semicolons and brackets can damage your code a lot more than you can imagine. Even though experienced developers tend to focus more on the logic driving the code yet syntax also demands and deserves a lot of attention.
It is a good practice to resolve all the syntax errors before diving deep into the technicality of the code.
- All the semicolons and brackets must be in place.
- All the HTML elements should be closed.
- The typing errors should be eliminated.
Such seemingly meaningless mistakes can change the entire meaning of your code.
Identify bugs and rectify them quickly with the help of LT Debug.Try LambdaTest Now!
Blackbox Some Scripts
Due to its asynchronous nature, many developers find debugging JavaScript quite challenging. However, with the introduction of libraries and frameworks, the task has been simplified a lot. Libraries and frameworks are pieces of code supposed to be used as they are according to the demands of the software. They are already well tested and made bug free by their developer. While debugging your code, you do not need to test them all over again!
Hence, it is a good practice to blackbox these scripts so that the debugger does not waste a majority of its time just to confirm the already known fact that they are bug-free. The principle can even be extended to your own scripts. If you have separately tested a relatively large script and are sure that it is bug-free, you don’t need to test it again while debugging the rest of the program. Blackbox it and make your life easier.
Check Cross-Browser Issues
A majority of the display problems related to HTML and CSS are cross browser issues. Your code may be written perfectly well but giving you a hard time because of browser compatibility issues. In such a situation, rather than finding errors in the code, you must address cross browser aspects
A pro tip to reduce cross browser issues is to ensure that they are not there in the first place. It is nice if you are making use of a decent CSS reset. Using this would level out a number of inconsistencies between the browsers, making them behave more uniformly.
Another recommended practice is to use only those properties and features of HTML and CSS, which are supported by multiple browsers. To identify various cross browser testing issues you can use cloud-based platform like LambdaTest to test your website on various browser and help rectify issues in HTML and CSS.
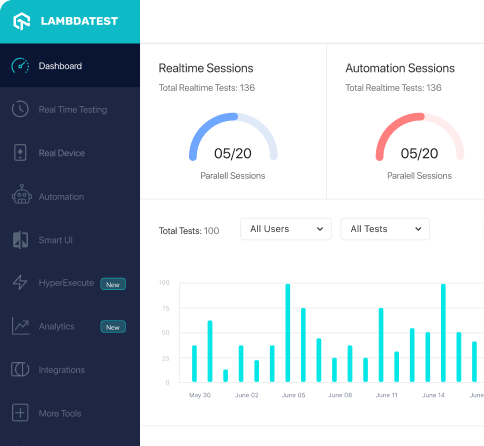
LambdaTest is an AI-powered test orchestration and execution platform that lets you run manual and automated tests at scale with over 3000+ real devices, browsers and OS combinations.
This platform offers LT Debug tool is a versatile debugging tool offering features like easy manipulation of request/response headers, URL filtering for request blocking, network throttling, query parameter management, URL redirection, user-agent string switching, CSS/JS injection, and more. Customers have reported no significant disadvantages.
Minification – Yay Or Nay?
Making the source code free of all unnecessary characters such as white space characters, new line characters, comments and block limiters without changing its functionality is called minification.
These are generally added to the code to enhance its readability but do not have any significance in executing the code. Debugging minified code, however, can be a pain. Most of the times you won’t have to deal with minified code, but the few times that you have to, it can give you some serious troubles. Pretty Print is an option in Chrome allowing you to debug minified code less problematically. No doubt, it would not be as helpful as the original code, but at least it will help you figure out what actually is going on in there leading to easy debugging.
Optimize The Development Environment a Bit
Optimizing the development environment a bit before starting with the process of debugging can also make it easier. For instance, consider Symfony. It creates large-sized PHP files in the system’s cache containing aggregates of PHP classes your software needs for every request. However, such a behavior confuses the debugger as the same class can be located in two separate places, namely the original class file and the large file created by Symfony. It is recommended that you disable the Bootstrap file and class caching beforehand in order to avoid the debugger from getting confused and do its job efficiently.
Hence, these were some of the best recommended practices for debugging code and websites in general. Apart from these, there are some general tips and tricks which must be followed like rules of thumb by any developer. For instance, you should always consider reproducing a bug before you blindly start editing the code. Additionally, you should consider writing a test case that reproduces the bug.
Don’t assume stuff
You should know what you are doing with the code. Wild-goose chase will only waste your time. Next, you should understand stack traces. Not all bugs have it, but for those which have, you must understand them thoroughly. Apart from that, you should know all the error codes well.
Besides, you should understand (and more importantly admit!) the fact that you cannot fix all the bugs.
If you have already spent an hour or two on a piece of code trying to locate bugs, you should pause there, call a friend or colleague and take some friendly piece of advice. You will be surprised at how easily someone else can spot the error you have been missing.
Lastly, you must celebrate all the debugging successes – doesn’t matter how major or minor they are. It will boost your morale and help you figure out the remaining bugs more easily.
Happy debugging!
And yes, Happy Testing 😉
Got Questions? Drop them on LambdaTest Community. Visit now


