What is Test Observability and How can it Improve your Testing Process
Dileep Marway
Posted On: April 12, 2024
![]() 56120 Views
56120 Views
![]() 20 Min Read
20 Min Read
Test observability refers to gaining complete insights into the execution of tests. It involves collecting and analyzing data about the testing process, enabling testers to understand, monitor, and optimize the behavior and performance of software under different conditions. These insights help improve the effectiveness and efficiency of the testing process by identifying issues, bottlenecks, and areas for improvement.
With the increasing complexity of software applications, ensuring that these applications function ideally and safely is crucial. Achieving this assurance requires comprehensive and genuine testing approaches. As software applications become more complex, the quality of the testing process must also evolve. This evolution necessitates the adoption of new and improved test approaches and methodologies.
One such effective measure is test observability, which involves gaining deep insights into testing approaches through thorough examination, data analysis, and efficiency measurement.
This guide will teach us about test observability, its importance, key components, tools, and best practices. We will better understand every component and segment associated with test observability. Additionally, we will explore the challenges and tools involved in ensuring the ideal testing of software applications.
- What is Test Observability?
- What is Observability in DeVops?
- Why does observability matter?
- Key Components of Test Observability
- Difference Between Test Observability and Testability
- How can you Add Observability to your Testing Process?
- Testing in production
- Test Observability Tools
- Test Observability Challenges
- How long will it take to Implement Test Observability in your Organization?
- Key Advantages of Test Observability
- Frequently Asked Questions (FAQs)
What is Test Observability?
Test observability refers to obtaining comprehensive insights into the execution of software tests. It encompasses gathering and analyzing data about the testing procedure to grasp, supervise, and enhance the functionality and efficiency of software across diverse scenarios. Such insights are invaluable for improving testing procedures’ overall efficacy and productivity by pinpointing concerns, obstacles, and areas for improvement. Test observability ensures software reliability and quality by providing valuable information for informed decision-making during testing.
Both software engineering and DevOps consider test observability a crucial process, as it provides developers and testers with a simplified view of complex systems. Observability involves externally monitoring the entire system through data analysis without delving into its internal complexities.
Test observability facilitates more straightforward test and verification processes and provides access to a wealth of historical data on the software’s responses. This historical data helps developers identify efficiency threats and stability issues, enhancing the testing approach.
What is Observability in DeVops?
Observability in DevOps involves dynamic tools and techniques enabling proactive system debugging. It centers on uncovering unforeseen patterns and attributes, rather than predefined ones, fostering comprehensive understanding for effective operational insights.
People who use observability are seen to be 2.1 times more likely to detect any issues. Another benefit is that it has been reported that there is a 69% improvement in the meantime to repair (MTTR), which is how quickly an organization can respond to unplanned breakdowns and repair them.
Observability is great as it allows us to see what is happening in a test rather than wait for the final output.
With the push to the cloud, there are more changes and dynamism around changes. This means that it is difficult to deal with unknown things, for that reason observability is a lifesaver as it allows us to tackle the complexity.
This is a critical component of effective testing, DevSecOps, and software development. Teams can then use this data to build better, more secure, and more resilient applications.
Key Components of Test Observability
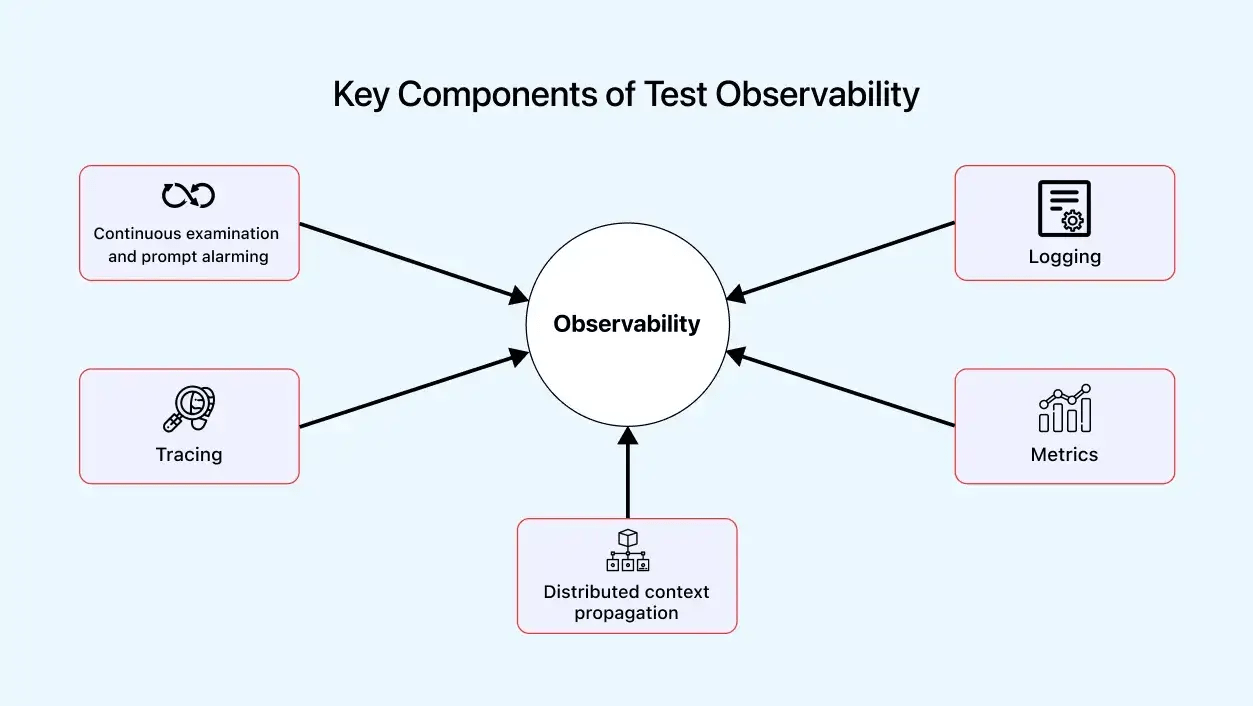
A robust framework is essential for the better performance of almost every process, and test observability is no exception. It incorporates plenty of components and performs various functions. The components have varying characteristics and, therefore, execute different functions. Below is a detailed description of each prominent test observability element.
-
- Continuous examination and prompt alarming: It is essential to perform a continuous examination through test observability. It involves analyzing metrics and parameters like resource and capacity utilization, response rate, error frequency, anomaly chances, and volume acceptance efficiently. The data collected during this process helps handle these aspects and accurately highlights the data points, saving time.
Moreover, continuous monitoring ensures deviations from the system’s expected behavior lead to quick and accurate alerts. It helps resolve bugs before they reach a critical stage, as testing engineers and developers are notified promptly and can take suitable measures to fix the issues.
- Logging: It involves the maintenance of continuous logs, including a chronological series of events such as inputs and responses, error occurrences, and actions taken.
- Tracing: It involves transporting and tracking the prompts input to the software through different code facets of the software application. This extensive monitoring provides a detailed analysis of the time taken at every point and identifies inefficiencies, pinpointing spots with scope for improvement.
- Metrics: It measures and represents the quantitative data collected throughout test observability, considering the extent of data acquired. Metrics collect CPU load, storage utilized, response rate, etc. These data types provide a statistical report for improving and maintaining the system and its operations.
- Distributed context propagation: In more complex systems, it is essential to have a comprehensive understanding of the flow of transactions or input through the various components of the system. Distributed Context Propagation, or DCP, traces the pathways of these queries and assesses their functionality across each stage of the code. This process helps gain a thorough understanding of the behavior and path of requests, even through inter-modular programs.
Why does observability matter?
- If we want to ship new features faster and resolve issues before customers are impacted it is key that we have a strategy in place around observability.
- It decreases our development time as we can diagnose issues more quickly.
- We can increase our testing coverage, thus resulting in fewer escaped defects – which in turn means better quality software.
- Better quality software means that our customers will be happier – which in turn means a positive business impact.
- It has been shown that those who focus on observability have a competitive advantage.
- Allows developers and testers to diagnose issues during testing. This means fixes can be understood more easily and they can be resolved.
- Without observability, it is hard to determine the cause of the failure, so it is harder to fix and it can slow down the development process.
Lack of observability is a massive risk. Take for instance we have a production issue, without observability in place it would be very difficult to troubleshoot the issue and in most cases, it will take 3 times the time to find a root cause if that is even possible.
On top of this, the brand reputation can be damaged, developers will be frustrated and issues with your product will sit unresolved.
Difference Between Test Observability and Testability
Test observability and testability are interconnected concepts in software testing, although they emphasize distinct aspects of the testing process.
| Features | Test Observability | Testability |
| Definition | Involves gaining insights into a system’s internal state and behavior during testing through monitoring, logging, and data collection. | Measures how easily a system or application supports and facilitates testing activities. |
| Objective | Enhance understanding of the system’s dynamics during testing, aiding in debugging, performance analysis, and issue resolution. | Streamline testing activities, making them more efficient and reducing the effort required for validation and verification. |
| Timing | It is implemented during testing to provide real-time insights into the system’s behavior under different test conditions. | It is addressed during the development phase to ensure the software is designed with testing considerations in mind. |
How can you Add Observability to your Testing Process?
Ultimately it can be used by anyone in a software development life cycle including developers, testers, and DevOps.
For instance, you can look into:
- Using logging – will help you to track what is happening before and after any operations in your code.
- Using debugging tools – you can add breakpoints and steps through the code to identify issues during testing. This is great for reproducing difficult issues and from experience, this was a lifesaver for me when I was a developer.
- Use monitoring tools – these are real-time insights into the performance of your applications, report usage, and error rate. Monitoring tools are a key aid and it would be difficult to find these in testing.
- Test automation – allows you to run your tests more quickly, at any instance of the life cycle.
My advice would be to start small and then use that confidence to move forward. It is also key that business benefit is taken with some ‘quick wins’. Look into your user logging and debugging tools as a starting point as these are not complex tasks.
Testing in production
Observability facilitates testing in production by providing detailed information about the production environment and the infrastructure. As per my experience, testing is an educated approach to validate a system’s correctness, though it does not predict some edge cases or possible issues that may occur in production.
For that reason testing in production allows us to test code changes on live user traffic, catch bugs early and improve customer satisfaction.
There are two ways to conduct testing in production environments:
- A/B testing – analyze if changes lead to a better user experience, with observability it is easier to see the impact.
- Continuous monitoring – with this you can discover issues with the software.
Test Observability Tools
Observability tools are crucial for monitoring software tests and applications. They assist developers and testers in identifying problems, enhancing performance, and ensuring software reliability by providing vital information about behavior and performance. These tools are essential for ensuring the stability and effectiveness of software systems.
1.LambdaTest Test Observability Platform
It is an AI-powered centralized platform designed to streamline the gathering and analysis of test execution data from multiple sources. Its test observability platform offers a single dashboard where users can access real-time insights, enabling them to make informed decisions about their testing processes. This platform helps improve efficiency and effectiveness in testing by providing a comprehensive view of testing data.
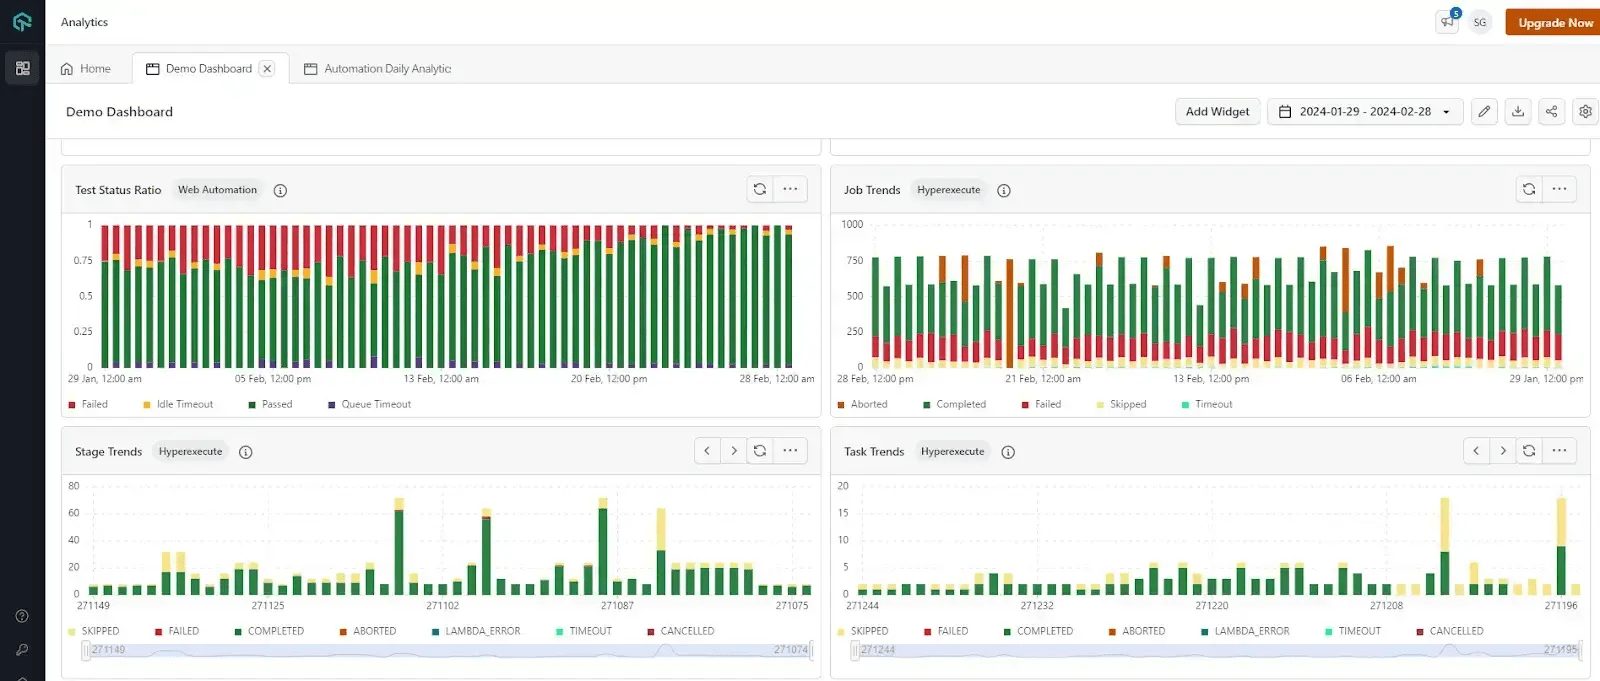
Features of LambdaTest Test Observability Platform:
- Test Analytics: Unifies test execution data from various LambdaTest products for real-time insights. It offers the following insights:
- It provides a test case health summary that helps focus on inconsistencies in test execution, helping identify tests that sometimes pass and sometimes fail, indicating potential issues in their design or execution.
- It provides an overall test summary to view the number of tests executed, categorized by status (e.g., pass, fail, skip).
- It enables users to track the performance of tests over time, helping identify trends in pass/fail rates and potential improvements needed in the testing process.
- It provides detailed information about errors encountered during testing.
- It offers insights into how your team is using LambdaTest resources.
- It helps testers pinpoint the nature and distribution of errors across different test categories. This enables focused debugging efforts and quicker resolution of issues impacting your software.
- It analyzes data specific to the HyperExecute platform (cloud-based test execution).
To learn more about various products offered by LambdaTest, such as LT Browser and LT Debug, subscribe to the LambdaTest YouTube Channel. You’ll get the latest updates on products and tutorials covering Selenium testing, Cypress testing, Playwright testing, and more.
2.Prometheus
It is the standard for monitoring, focusing on metrics gathering and enabling alerts. It utilizes a robust time-series database for storing high-resolution metrics data and offers multiple visualization modes for analyzing data from backend services.
Features of Prometheus:
- It stores long-term metrics data for historical analysis using an efficient time-series database with scaling functionality through sharding and federation.
- It creates powerful alerts using PromQL, a flexible query language that maintains dimensional information.
- It pushes metrics and alerts to other tools in your observability infrastructure using open-source client libraries and integrations.
- It is primarily a metrics collection and alerting tool; it does not directly assist backend developers with testing their services.
3.Jaeger
It is an open-source end-to-end tracing tool that helps developers monitor and troubleshoot transactions in distributed environments. Its primary goal is simplifying the debugging process for developers working with distributed services, which is inherently more complex than working with monolithic systems.
Features of Jaeger:
- It monitors transactions between distributed services to understand infrastructure health and performance.
- It performs root cause analysis by examining individual transactions that may cause user-facing issues.
- It optimizes performance and latency by identifying services that respond slowest to requests.
- It is designed explicitly for end-to-end tracing and does not include tools for developing tests for backend services.
4.Grafana Tempo
It is an open-source, high-scale distributed tracing back-end designed to collect and store trace data. Released under the AGPLv3 license, Grafana Tempo is developed and maintained by Grafana Labs, known for other open-source projects like Loki for logs, Grafana for metrics visualization and alerting, and Mimir for metrics storage.
Features of Grafana Tempo:
- It consumes trace data from popular open-source tracing protocols such as OpenTelemetry, Jaeger, and Zipkin.
- It provides affordable long-term storage for trace data, enabling historical trends and analysis.
- It facilitates tracing implementation in backend services; it does not offer tools for writing or executing tests.
5.SigNoz
It is an open-source alternative to enterprise-level observability platforms such as Datadog and New Relic. Unlike some generalist tools, SigNoz specializes in Application Performance Monitoring (APM), focusing on measuring performance from the end-user experience perspective to help developers address issues proactively.
Features of SigNoz:
- It supports OpenTelemetry for instrumentation and generating application trace data.
- It offers a unified UI for metrics, traces, and logs, reducing the need to switch between tools like Prometheus and Jaeger to debug and troubleshoot issues.
- It provides flame graphs and individual request traces to identify the root cause of performance issues.
- It allows for building dashboards and alerts based on log attributes.
- It enables visualization of the slowest endpoints in an application.
6.OpenSearch
It is an open-source database for inserting, searching, visualizing, and analyzing data. It is built on Apache Lucene, a FOSS library for indexing and search, which enables OpenSearch to offer advanced analytics capabilities such as anomaly detection, machine learning, and full-text search.
Features of OpenSearch:
- It Ingests trace data from OpenTelemetry or Jaeger for visualization and performance problem identification.
- It uses community plugins to gather observability data from Prometheus and customize the output with rich visualizations.
- It filters, transforms, normalizes, and aggregates data to simplify analytics and visualizations.
- It collects metrics, traces, and logs that can be used for validating tests; it does not offer features to help developers create, deploy, or manage tests. Developers will need to use a separate tool and connect its outputs to OpenSearch for testing purposes.
Testers and developers still encounter challenges when implementing test observability despite the tools and techniques available. In the following sections, we will explore some of these challenges developers and testers face.
Test Observability Challenges
Observability is a mechanism for better decision-making and optimal system performance, enhancing software quality and reliability throughout every testing phase. However, there are challenges related to test observability. These challenges include:
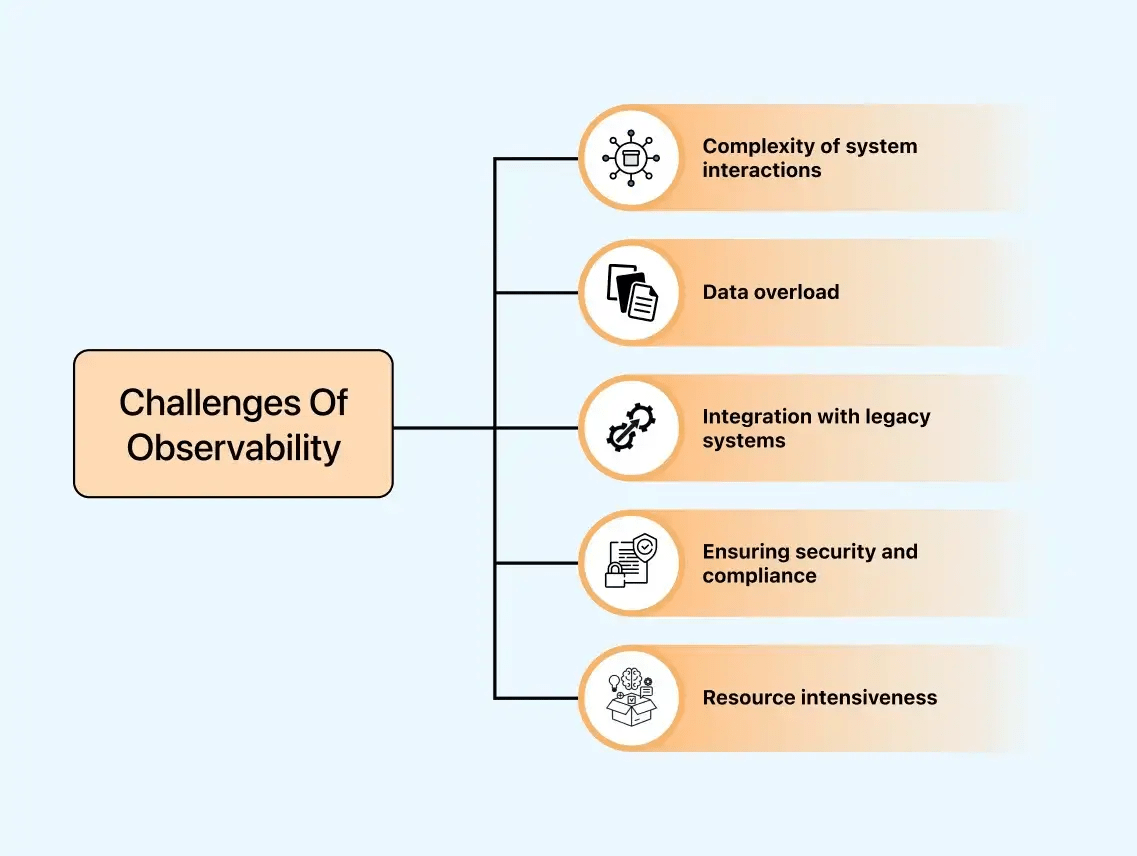
- Complexity of system interactions: Complex systems present challenges for test observability due to the complex interactions among numerous components. Tracing the flow of transactions and understanding dependencies becomes complex, often requiring advanced tools and techniques.
- Data overload: In testing, the large volume of generated data can lead to information overload, making it crucial to distinguish essential signals from noise. Insufficient filtering techniques can reduce the effectiveness of observability.
- Integration with legacy systems: Integrating observability into legacy systems can be challenging due to potential compatibility issues. Older systems may lack the necessary instrumentation for comprehensive observability, requiring additional efforts for rebuilding.
- Ensuring security and compliance: Collecting and analyzing sensitive data is integral to observability. Maintaining data integrity and preventing privacy breaches requires adherence to security and observability protocols, especially in regulated industries.
- Resource intensiveness: Implementing observability procedures may require significant resources. Balancing the need for sufficient data for insightful analysis with resource constraints can be challenging, particularly in environments with limited resources.
How long will it take to Implement Test Observability in your Organization?
This depends on the complexity of the system in question, the testing framework, and the level of observability required. Basic features like logging and debugging are easy to do and can be added quickly – in hours or days.
More advanced features like monitoring tools or profiling can take a lot longer. In these instances, proof of concept is key where course corrections are implemented if you are going down the wrong avenue.
In our DevSecOps team, the types of questions that we asked ourselves initially were:
- Do we have any logs for the end-to-end customer journey?
- Do we need any dashboards for capturing business metrics?
- Do we need any alerts when this feature is due to go live?
- Are we solely focusing on metrics when we should be looking at observability AND metrics?
Key Advantages of Test Observability
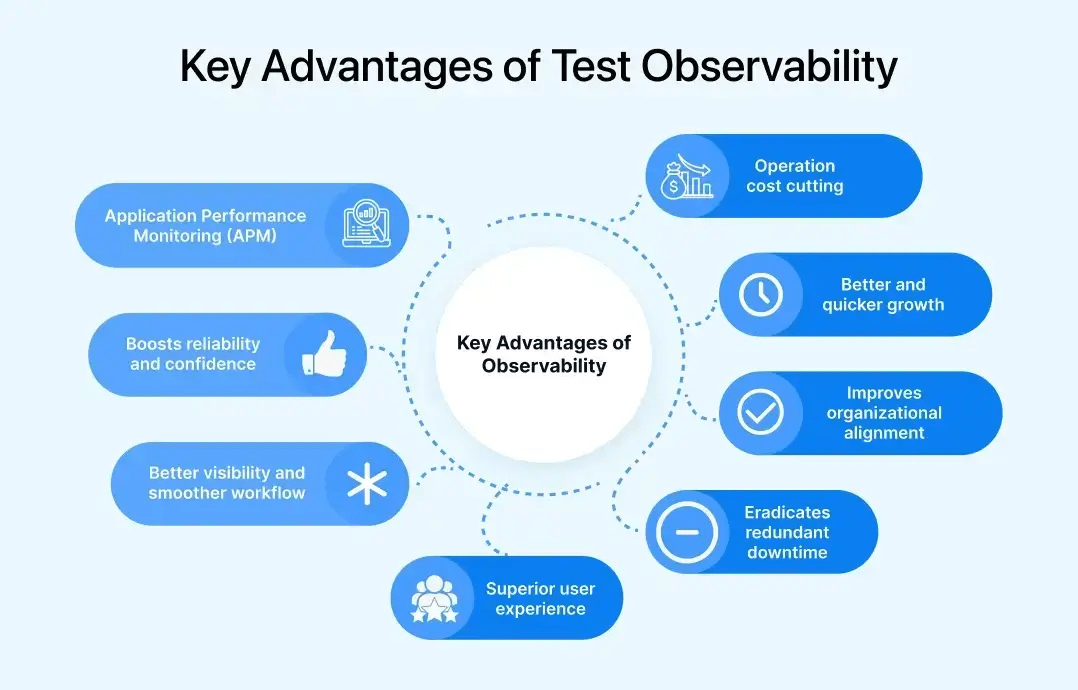
Although test observability is an obvious approach to increasing efficiency and precision in the testing process, many other applications exist for implementing this intricate concept within test suites. Some of these include.
-
- Application Performance Monitoring (APM): APM is an observability strategy that provides high monitoring abilities with insights into the operational anomalies of the system. Bugs sourced from microservice architectures and cloud-native environments can also be tracked through APM.
- Operation cost cutting: Time is money in almost every developmental field. With precise tracing of issues and historical data at fingertips, observability allows quick and impactful handling of issues. It saves time and capital. Moreover, with continuous data monitoring and analysis, redundancy is reduced significantly. It smoothens the process of bug fixing and performance boosting and, in turn, cuts off operation costs.
- Boosts reliability and confidence: Broadly, the process of test observability stands on two concepts: firstly, through continuous monitoring, it examines the seamlessness of the system’s performance, and secondly, through the rich data collection, consistent assessment channels and history of responses, it analyzes and pre-determines critical issues and errors.
Thus, for complex cloud native environments where visibility becomes one of the major factors, observability plays a protagonistic role. Observability boosts the stakeholder’s confidence by offering reliability for complex structures where manual wisdom starts surrendering.
-
- Better and quicker growth: With components like tracing and metrics, observability also brings customer satisfaction. For recurring errors in the user interface, which act as a hassle in the consumer experience, observability concepts can track down the issues quickly and provide relevant measures and data for the solution.
It brings about a sudden optimization in the Mean Time to Detection (MTTD). Statistical research from renowned authorities like Forbes suggested considerable improvement in the efficiency of 3/4th of the organizations that incorporated test observability in their systems.
In addition, with the combination of the visualized quantitative data, logs, and tracing of user pathways, observability gives an idea regarding the general interest of the user interest. It thus presents data and references for further upgrades and improvements in distributed software applications.
- Better visibility and smoother workflow: Visibility becomes a major obstacle, especially in complex and distributed software systems. Developers often need clarification concerning the flow of queries across the application. In such cases, observability connects them with the natural flow of information and simplifies bug fixation.
- Improves organizational alignment: With the help of test observability, the organization gets a broader overview of its IT setup. The technology helps companies advance the alignment of information security teams, developers, and ITOs.
- Eradicates redundant downtime: As discussed in the context of operational costs, unwanted and elongated downtime is significantly reduced with the help of test observability. The bugs and errors evolving out of the systems are detected early and resolved accordingly, thus reducing the MTTR or MTTD to a great extent and improving productivity for the organization.
- Superior user experience: Better tracking of customer usage in distributed system pathways and rich metrics and logs associated with observability allow the developers to improve user satisfaction significantly. Moreover, early detection and resolution of issues prevent critical downtimes and impart seamlessness in the usage of the applications.
Now that we have learned its key advantages let’s explore the specific problems that test observability helps solve.
In summary
Observability should be a natural ally to all testers. Remember testers ask questions and observability does the same, but aims to uncover answers.
We are more alike than we think! Working together can accelerate successful delivery. Ultimately, it is a win for customer experience.
Frequently Asked Questions (FAQs)
What is test observability?
Test observability is the practice of gaining insights into the software testing process by collecting and analyzing data. It enables testers to understand and optimize software behavior and performance under various conditions.
Why is observability an important issue in testing?
Observability is crucial in testing as it offers a deep understanding of a system’s behavior, enabling the identification and diagnosis of potential issues at any stage of the software development life cycle, including the production environment.”
What data sources are considered for observability?
Observability relies on three primary data classes: logs, metrics, and traces.
What are the five pillars of data observability?
The five pillars of data observability are: Freshness, Volume, Schema, Quality, and Distribution, as well as Lineage.
What are the four types of test data?
A comprehensive test plan should incorporate four types of testing data: Normal Data, Extreme Data, Abnormal Data, and Live Data.
Got Questions? Drop them on LambdaTest Community. Visit now


