Observing Accessibility
Ioannis Papadakis
Posted On: May 23, 2023
![]() 23267 Views
23267 Views
![]() 4 Min Read
4 Min Read
Global Accessibility Awareness Month is here and we want to continue spreading awareness in the communities. In this article, we will emphasize how we can constantly observe accessibility criteria violated.
Importance of Observability for Monitoring Accessibility
Observability is the ability to measure the internal states of a system by examining its outputs.
And why do we need observability for monitoring accessibility?
The goal is to constantly measure our compliance with the accessibility criteria and validate the effectiveness of the engineering teams to deal with these types of defects!

Modern observability platforms like Grafana can facilitate the need to aggregate and observe these data. But before reviewing how we can actually use them let’s see what type of data we can monitor.
Building a Culture of Accessibility Testing
To begin observing the number of defects with their respective severity levels when using Time Series DBs, we need a set of data points. Axe core is used to run our accessibility tests internally and produce the needed data. Axe core can be integrated with any third-party solution or automation framework and cover roughly up to 57% of the WCAG criteria. This means you can leverage test automation to achieve shift left in accessibility testing but do not just stay in the automated workflows. You need to build a culture around testing for accessibility.
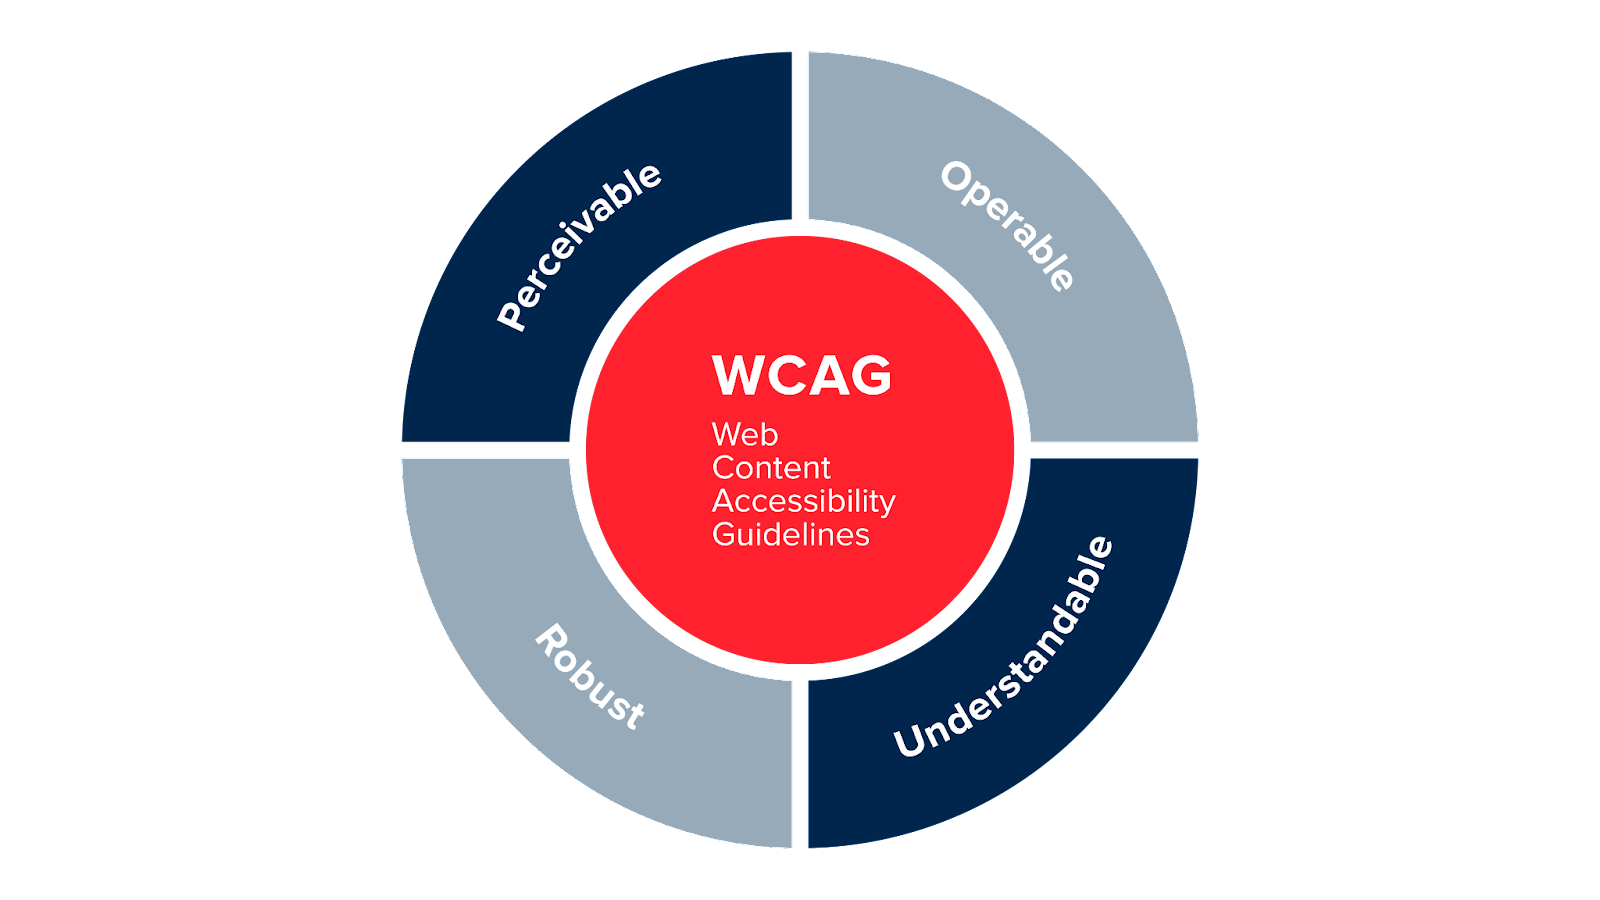
Before jumping to the practical section of our article let’s see how companies and organizations can leverage engineering teams’ awareness by an example. Going above the bare minimum demands a different approach and mindset from developers. React and Vue for example have accessibility integrated into them but developers should not rest themselves with whatever comes out of these frameworks in their day-to-day tasks. Many frameworks for example prioritise the visual aspects of accessibility but what about auditory or mobility issues? One basic example is when having video content in your software, the most effective way to make multimedia content accessible to persons with hearing disabilities is to include either captions or subtitles, or both.
The above example cannot of course be covered by automated tools and solutions so plenty of WCAG criteria needs to be performed manually by the teams. The first thing to organizations needs to understand the disabilities involved and then review what they can do for accessibility.
Harnessing Observability with Sitespeed.io
Coming to observability ways, we use Sitespeed.io which is an open-source web performance framework that can run axe core internally and aggregate the data to Graphite or InfluxDB and comes with predefined Grafana Dashboards to start visualizing our data.
It is particularly useful if you want to have a 2-in-1 solution for your site performance and accessibility compliance.
A basic example of scanning a page:
However you probably just want to configure run options, you can do that by adding a run prefix. Say for example you only want to test WCAG2AA compliance, you can do that with the runOnly configuration in AXE. You can do that with a configuration like:
Now with a single docker command, you can scan any page and collect accessibility violations. But how can we aggregate them and visualize them in Grafana?
Say we have installed our Graphite instance just add the following arguments from your CLI:
--graphite.host

--graphite.port
From here you just need to add the predefined dashboards to your Grafana instance to visualize your data.
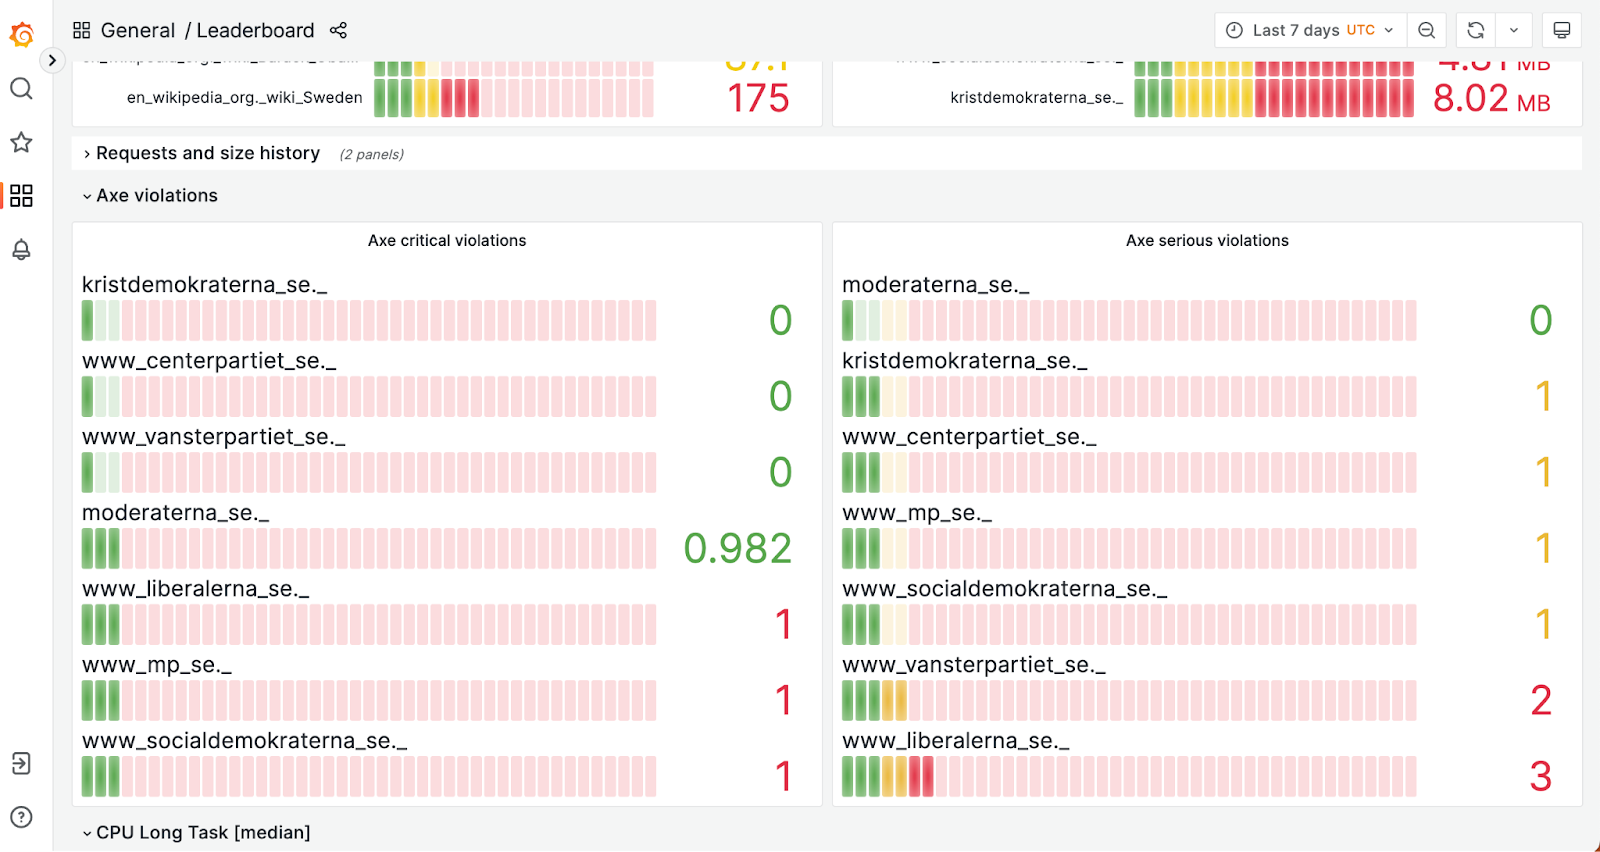
You can actually review side-by-side accessibility defects per page scanned which is extremely useful while testing multiple domains or sub-pages of your application. Grafana eventually can be used to monitor the number of violations in a longer period of time (depending on the retention policy of your DB) in order to have full access to historical data per release.
Conclusion
Observability is just about visualizing and reviewing any output of your system. When it comes to WCAG compliance we need engineering teams to be able to review the state of the success criteria for their apps at any time. Grafana is just one way to go but what really matters is the process of enabling teams in observability culture!
Got Questions? Drop them on LambdaTest Community. Visit now


