All New Updated Dashboard Fpr LambdaTest Users
LambdaTest
Posted On: April 23, 2018
![]() 13992 Views
13992 Views
![]() 3 Min Read
3 Min Read
‘Cross Browser Testing should be regular regime of your testing activity’ and having said that most of the customers we speak to agree to this. However most of the organizations look at cross browser testing as a one time activity which indeed leads to issues in later releases.
In the world dominated by web applications, performing Cross browser testing should be a continuous ongoing effort, however making sure that adequate effort is put in before releases needs to be tracked in teams. It becomes even tougher to track when you have distributed testing teams.
One such problem was faced by one of our customers Mike Hamann who is a Vice President at David Corporation. During our conversation we learnt that it was very important for Mike to track how much cross browser tests have been performed by individuals due to distributed teams they had in place. It was not all about monitoring but the aim was to put in practice of teams to take accountability of the same. This also helps to give birds eye view on how many cross browser compatibility issues are getting logged due to poor focus on front end development of the application which can be avoided in future releases.
And that’s exactly why we are here with our new dashboard and we owe this credit to Mike to share his feedback!
So, with his feedback we introduced a new dashboard in which the customers can track the progress of their team members on a daily, weekly, and monthly basis.
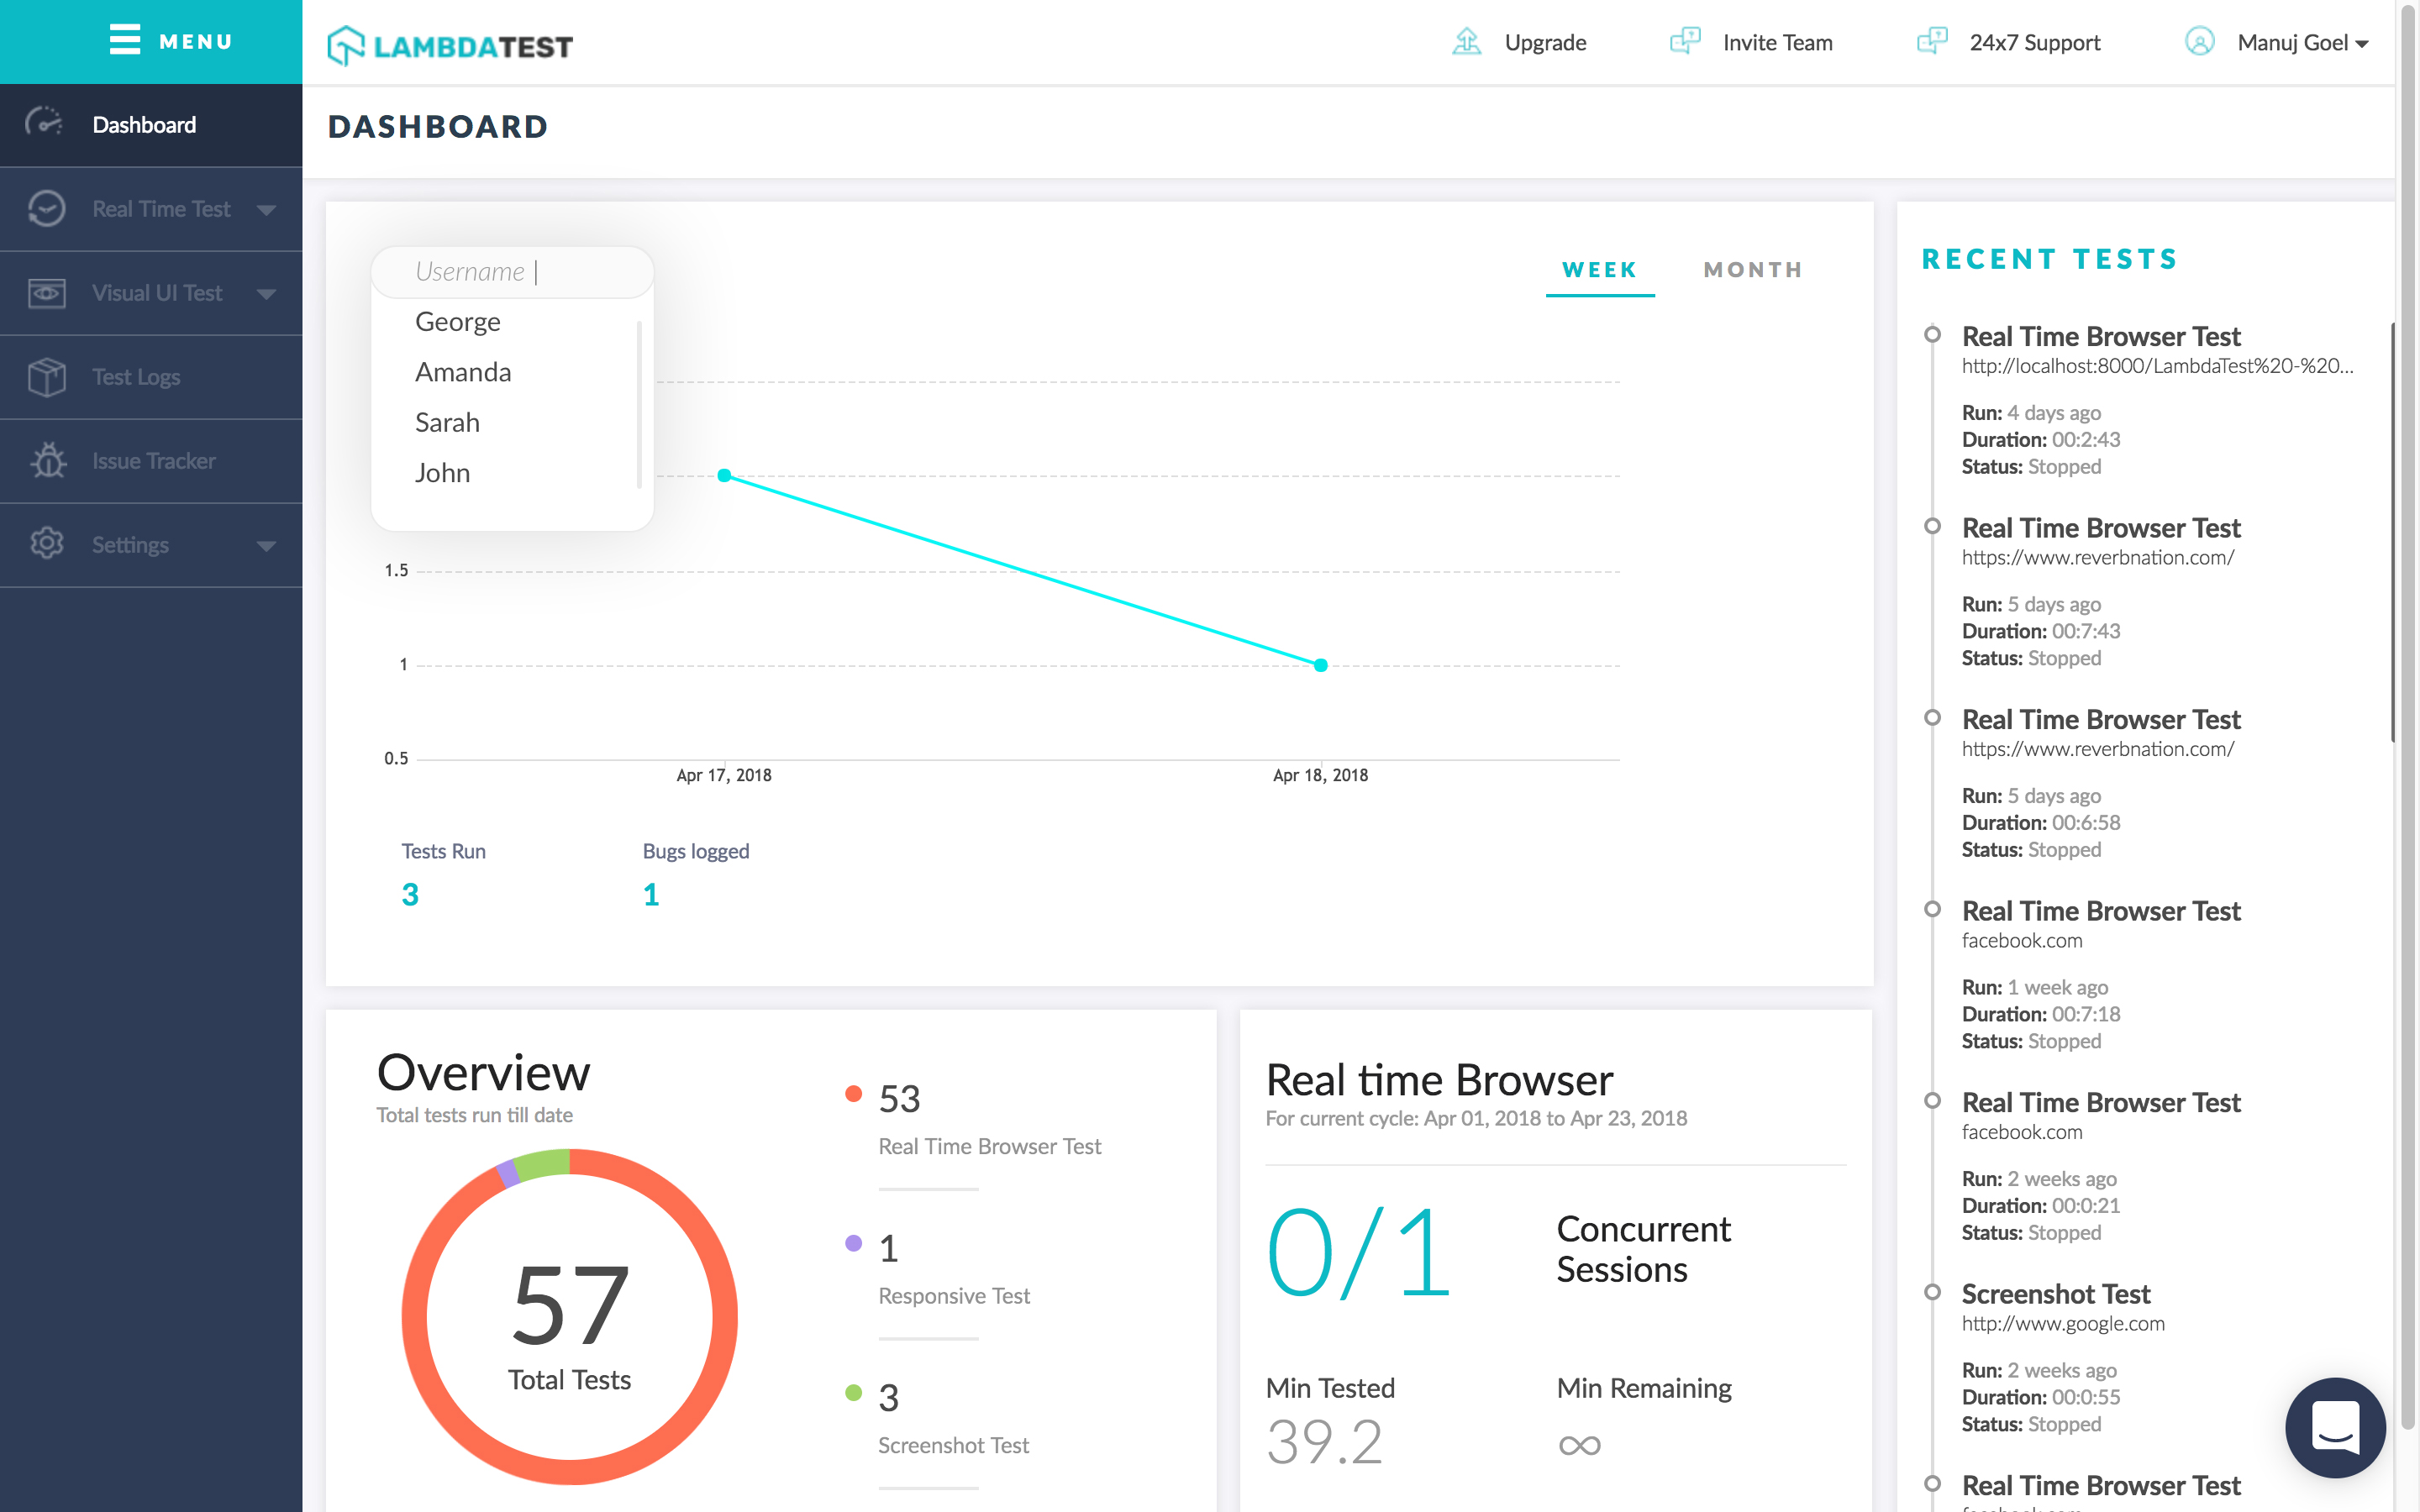
Here’s how the new dashboard looks like:

With this new dashboard, you can view the efforts of users on a daily, weekly and monthly basis. Here is what you get at a user level!
-No of tests performed
-No of bugs logged
This will help you to figure out how many bugs were logged in a specific day, specific week to infer how rigorous testing is your team performing.
The recent tests on the right side lets you keep track of the recent configuration used along with the URL recently tested, time of run, duration of test, and the status of test.
You can also find the overview of total tests run with the segregation based on the type of test performed. With this, you can also find the details of your real time testing including the minutes used and minutes remaining for the month with the number of active team members.
Seems like ‘ALL IN ONE PLACE’. Isn’t it?
Go and check out your dashboard, it’s all updated now. Let us know what you think! 😉
Happy Testing!
Got Questions? Drop them on LambdaTest Community. Visit now


