Introducing LT Debug: A faster, efficient, and simple debugging Chrome extension
Amrita Angappa
Posted On: July 14, 2022
![]() 41095 Views
41095 Views
![]() 12 Min Read
12 Min Read
We leverage Debugging tools, otherwise known as debuggers, to identify if there is any coding error present at different development stages and Software Testing Life Cycle (STLC). We can utilize them to check and repeat the conditions where a bug was found. We can then take a deeper look at the program state at a particular time while identifying the cause.
Debugging plays an important role in ensuring that software developers, engineers, and testers can fix every error before they release it to the users. This process is complementary to testing, where you learn how an error has occurred to the program.
With all these factors in mind -Drum rolls- LambdaTest is back with a brand new extension called LT Debug to make the life of testers easy and fuss-free while debugging.
Following the success of our responsive checker tools like LT Browser, we are excited to reveal yet another tool that could make developers and testers dive into the abyss of debugging and stay afloat in testing.
TABLE OF CONTENTS
- The story behind LT Debug
- How to install LT Debug?
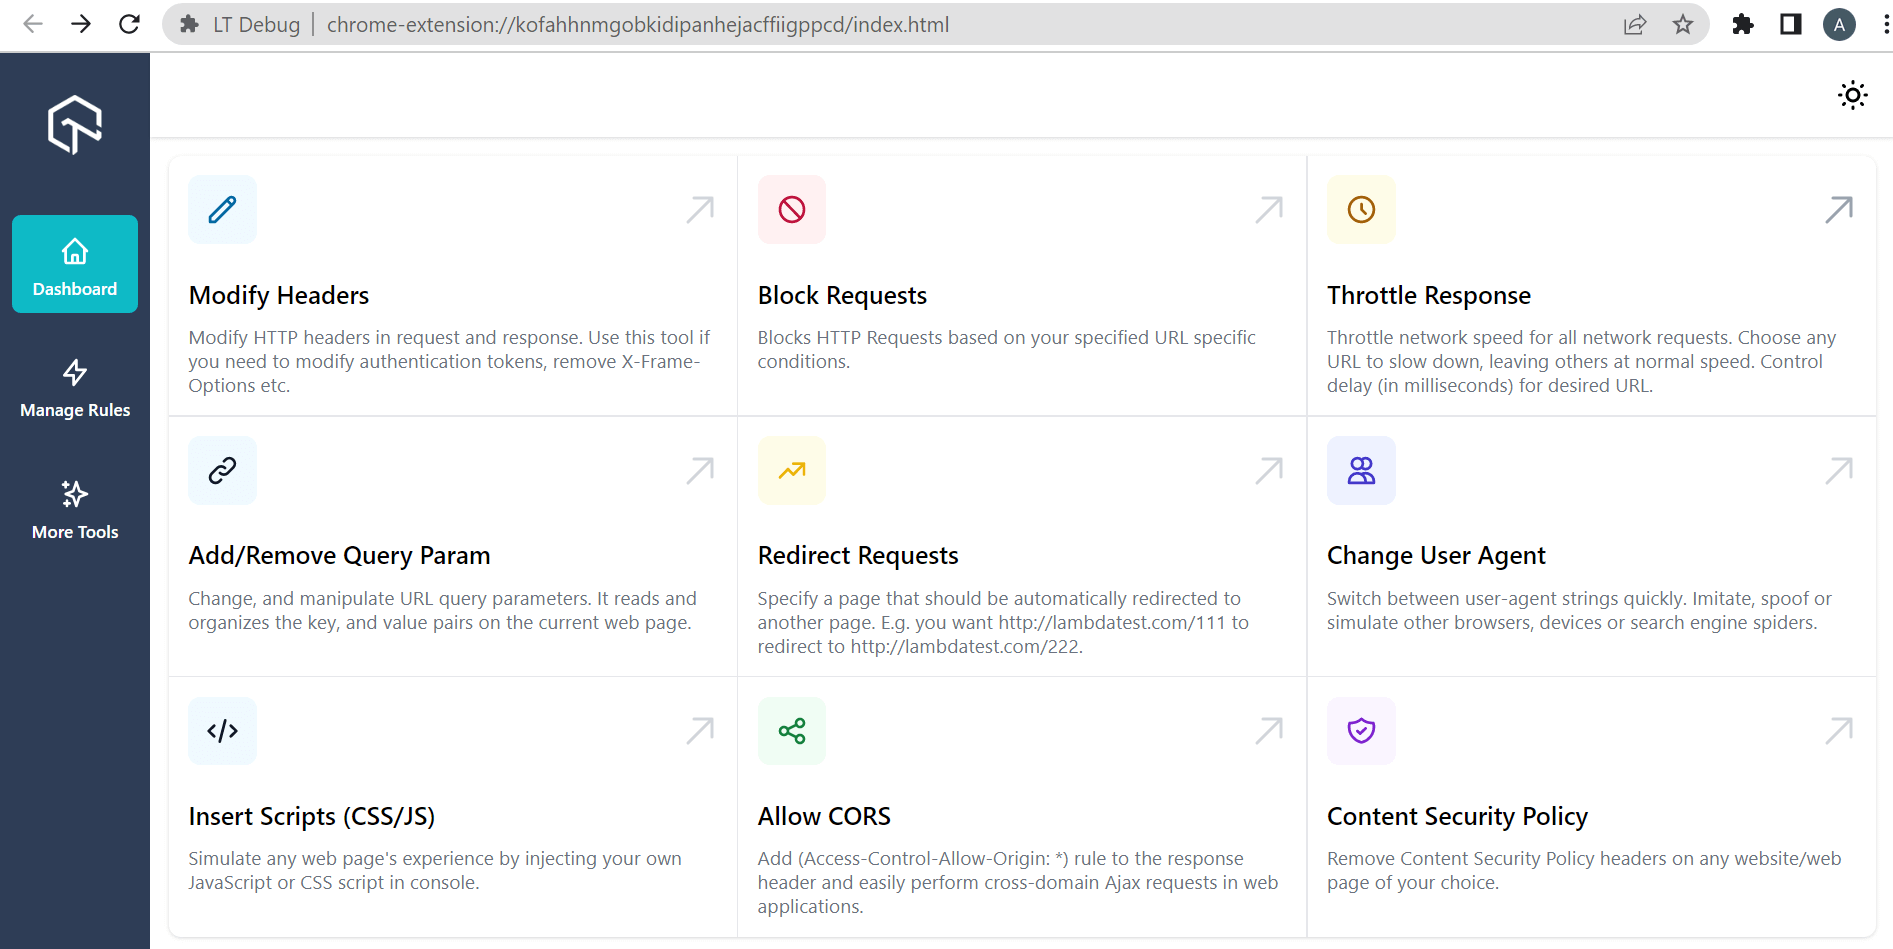
- Top features of LT Debug
- Add/Modify Headers
- Block Requests
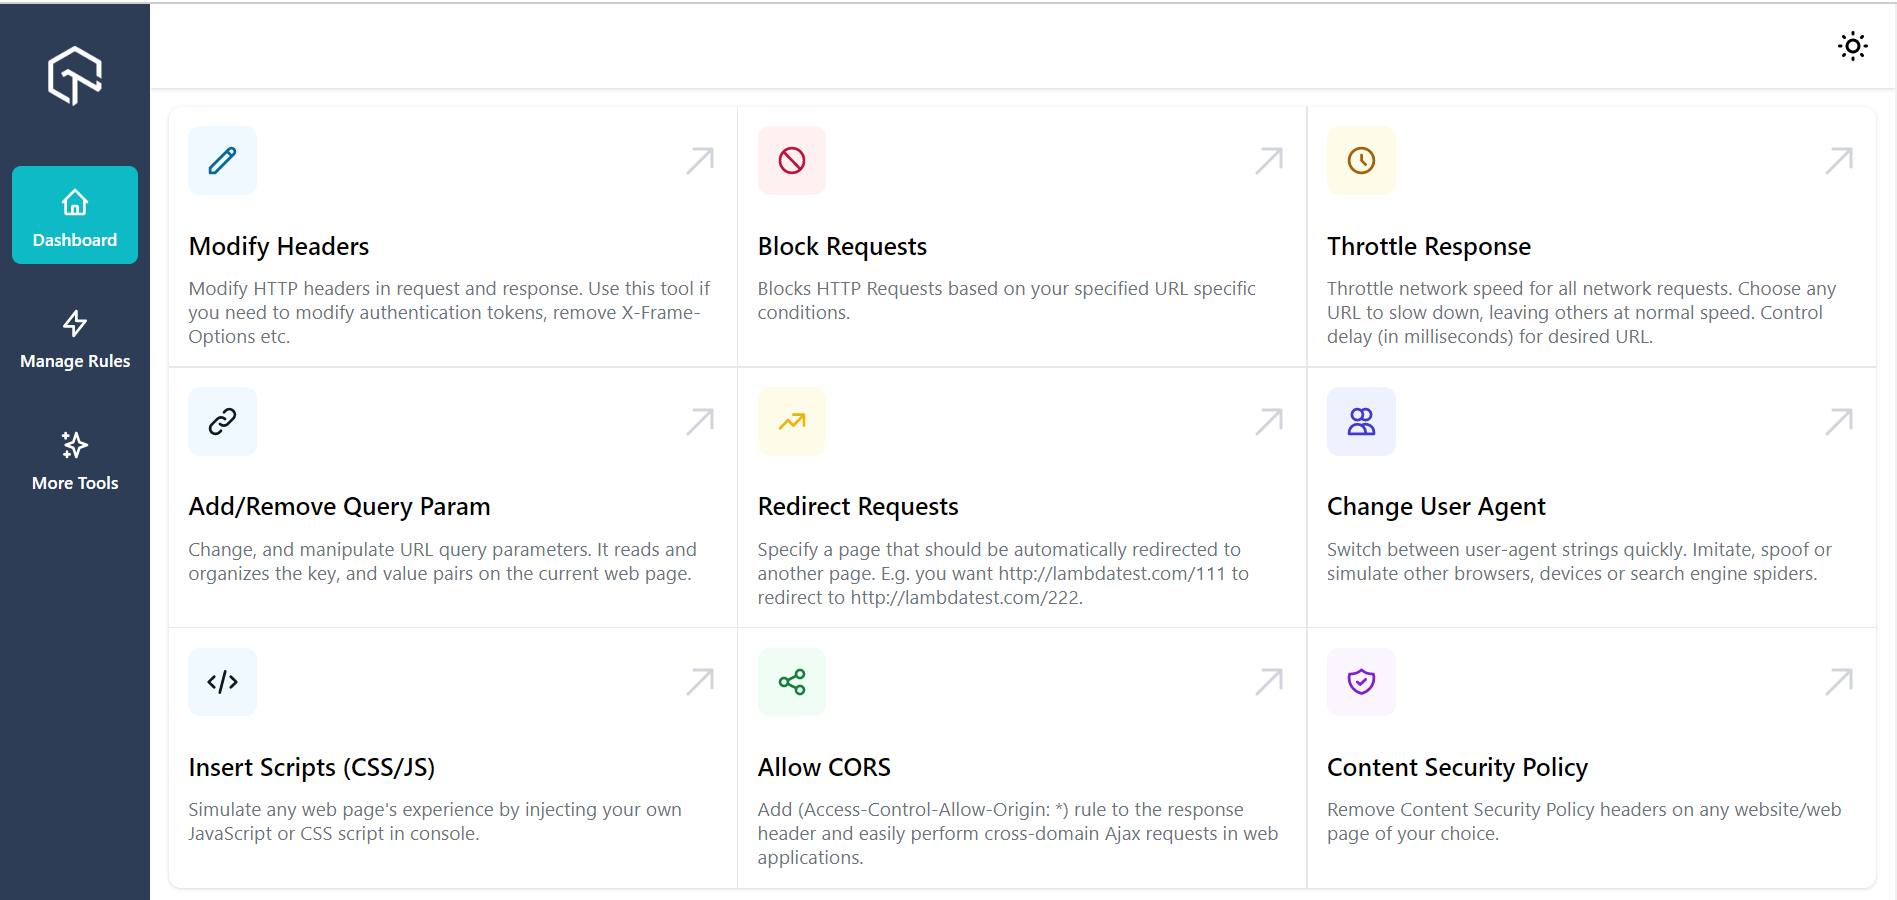
- Throttle Response
- Add/Remove Query Param
- Redirect Requests
- Change User Agent
- Insert Scripts (CSS/JS)
- Allow CORS
- Content Security Policy
- Why should you use LT Debug?
- Is there any other way to debug using LambdaTest apart from LT Debug?
- Can I use LT Debug on a different browser other than Chrome?
- Conclusion
The story behind LT Debug
LambdaTest is a product company on its own. We can understand the pain of testers better than Michael Scott (Much better!). We have been in the field of software testing and debugging for the past 5+ years. Our product at request team has kept their eyes, ears, and heart open to the testing community. They have listened to the requests of many awesome testers needing a debugging tool, Chrome extension.
The problem statement of testers worldwide is more or less the same when we talk about debugging. One of the most common challenges faced by testers is that they feel that debugging is directly proportional to long working hours with complex processes. It’s not always a cakewalk when you go to Google console to inject the test script. Paying a visit to the source code and changing it wouldn’t help much.
Now, here is a think tank: Is it easy to write a syntax and code or to write a syntax and fill the form?
The second option, obviously, right? That’s what made our team hop into brainstorming over many cups of coffee, take baby steps in product development, and finally, LT Debug is live!
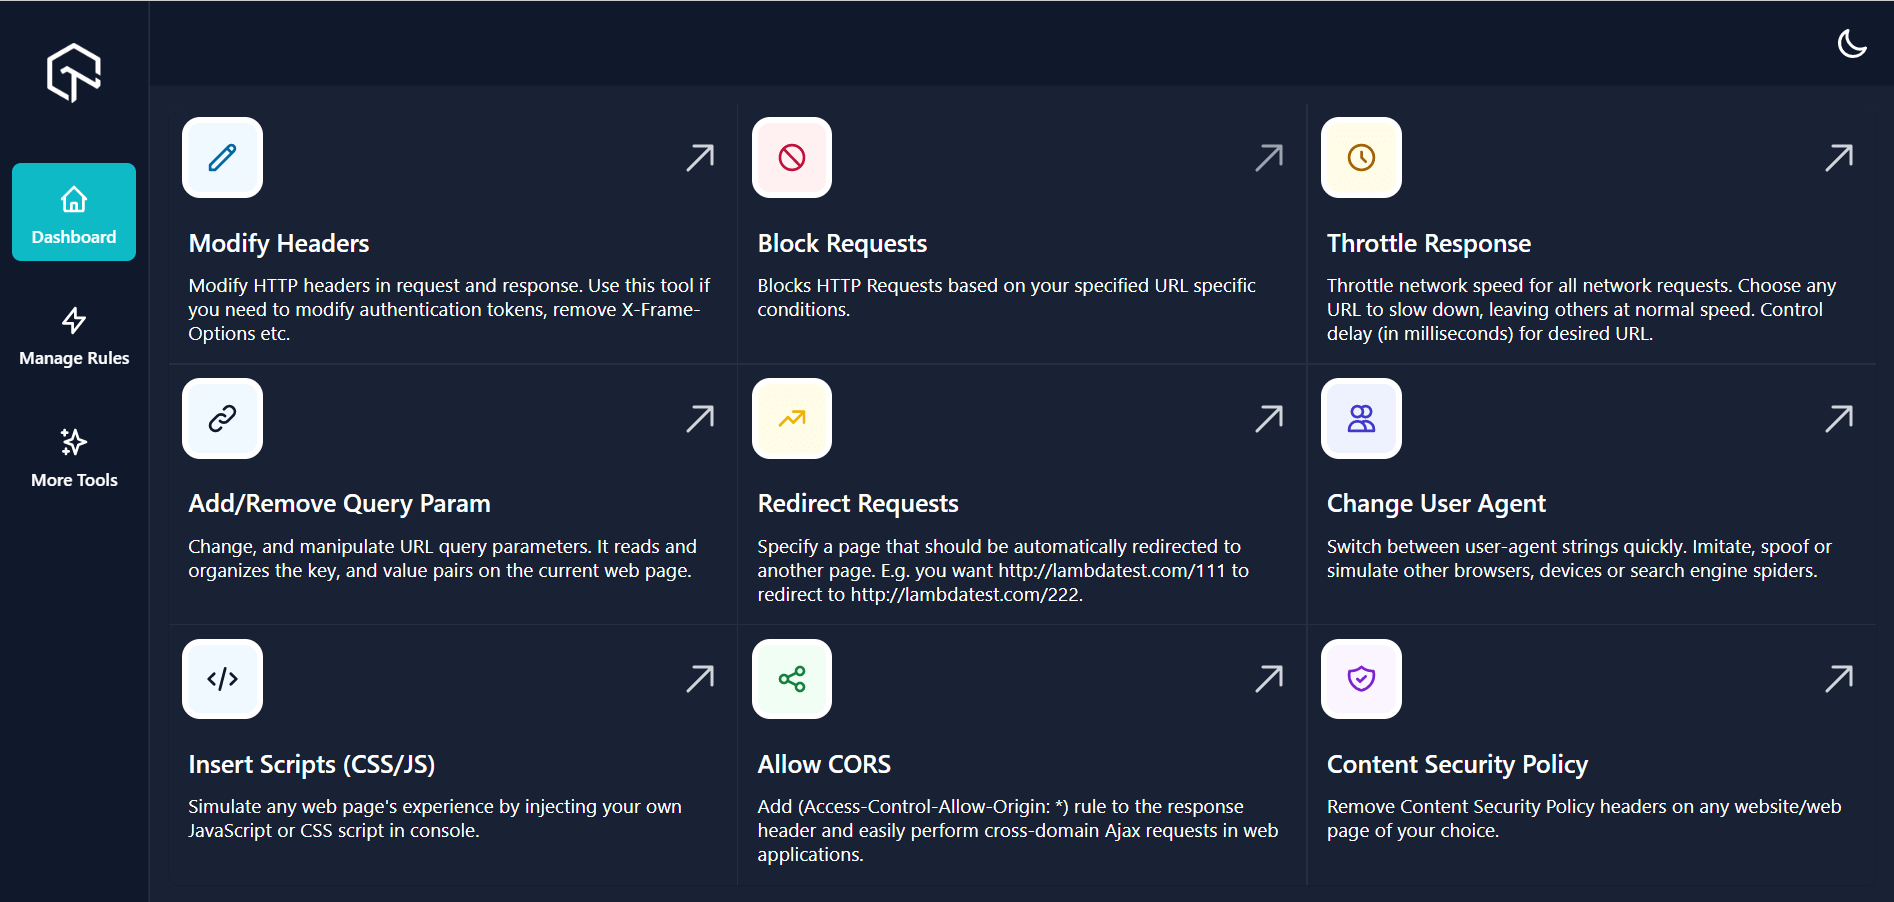
This free developer tool is simple-to-use with over nine amazing features used by web developers and testers during debugging on a day-by-day basis.
The coolest part is it’s available in Dark Mode with your system setup to ensure that even your little needs are taken care of by us. Now, get back to work without any strain. Just click on the sun and moon icon at the top right corner to activate them as per your choice.
Debug faster than ever!. Try LambdaTest Now!
How to install LT Debug?
Installation of LT Debug is as simple as spelling your name. Here is our simple step-by-step installation process:
Step 1: Go to the LT Debug Chrome Extension page.
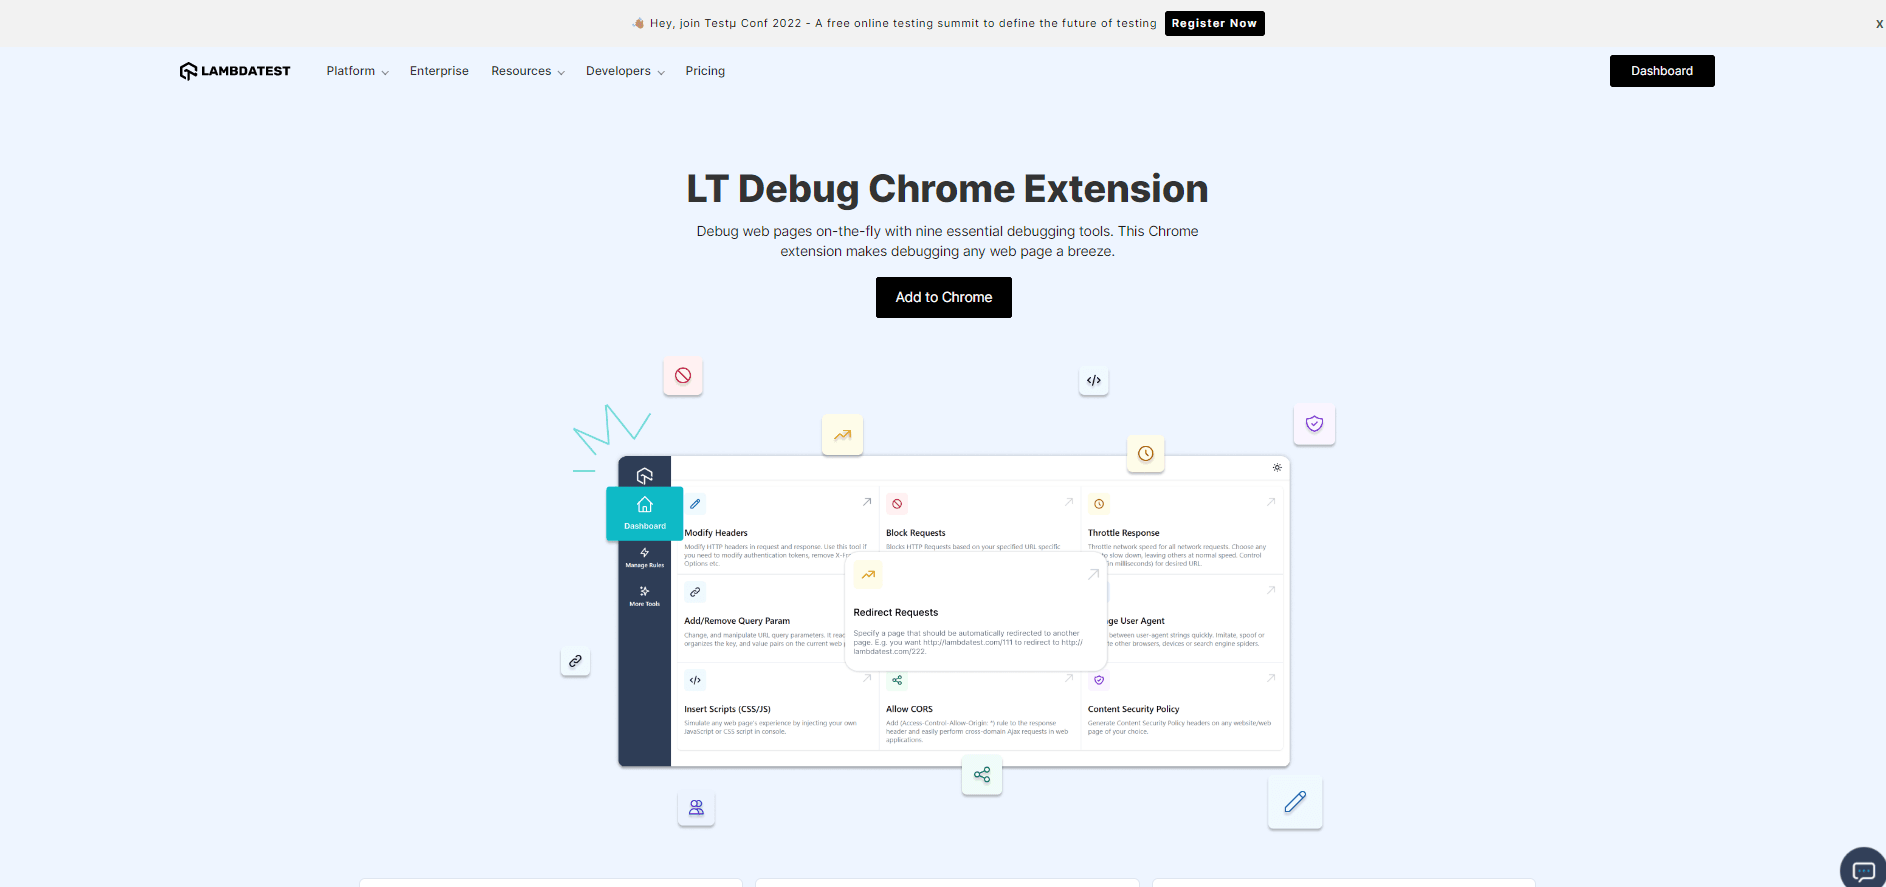
Step 2: Click Add to Chrome. You will be redirected to the Chrome web store.
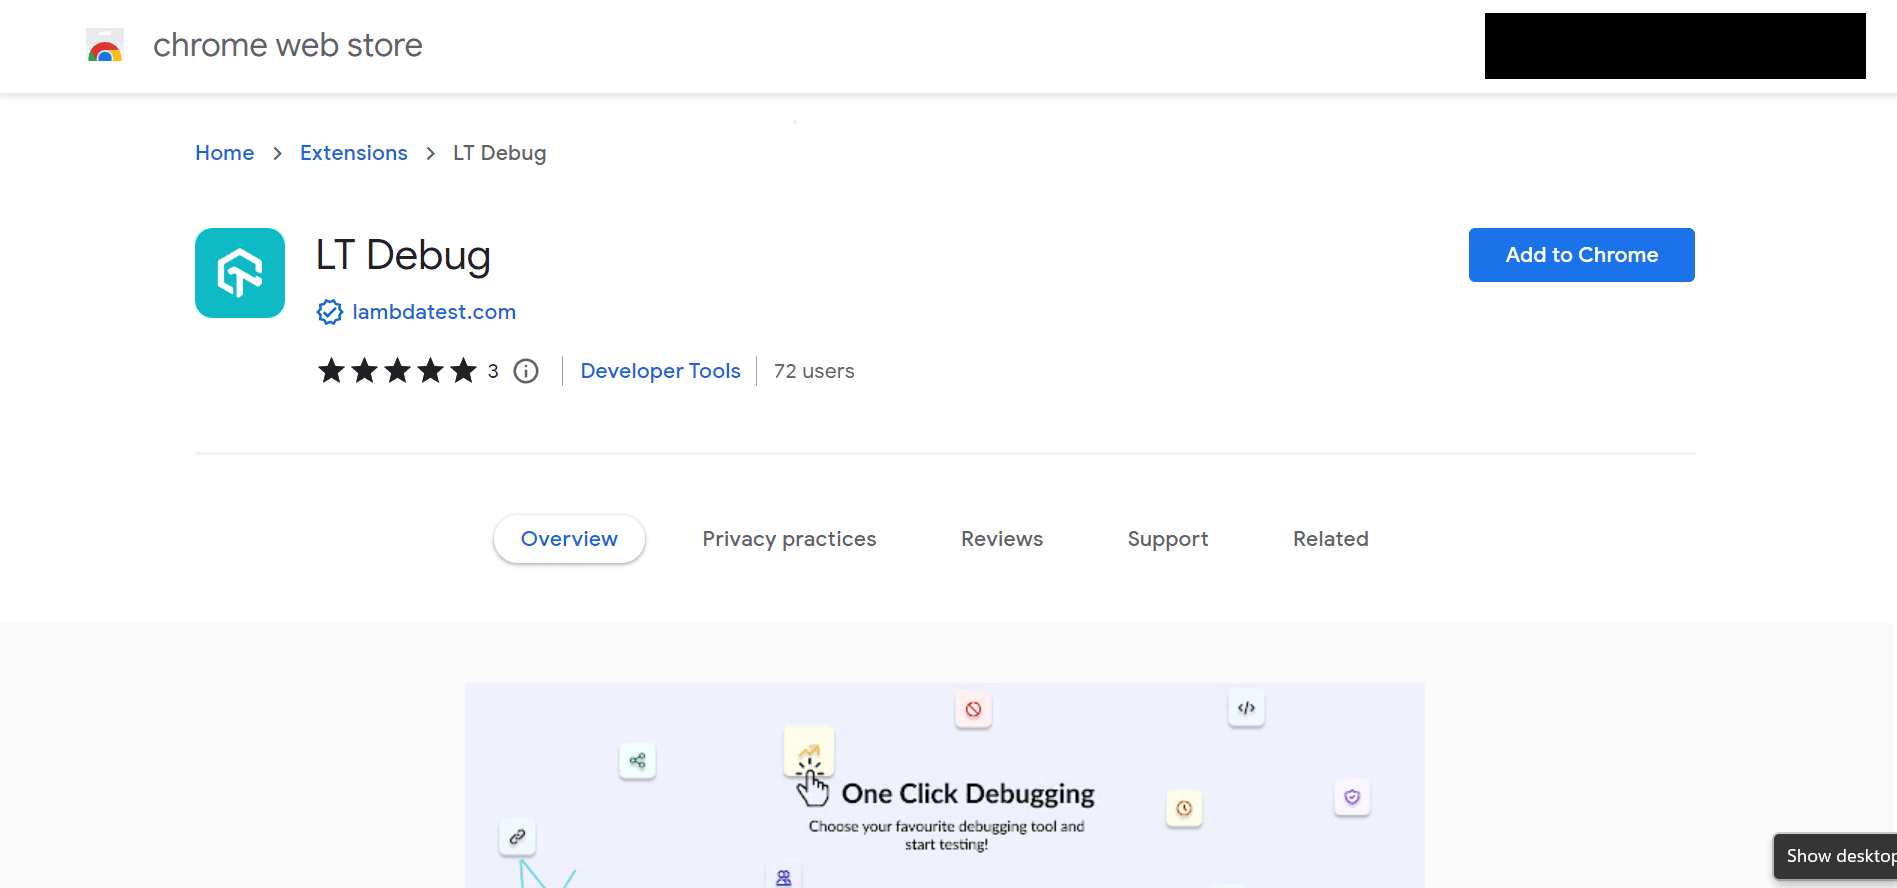
Step 3: Click Add to Chrome. A pop-up will appear asking if you need to add “LT Debug” to your browser. Click on Add extension.
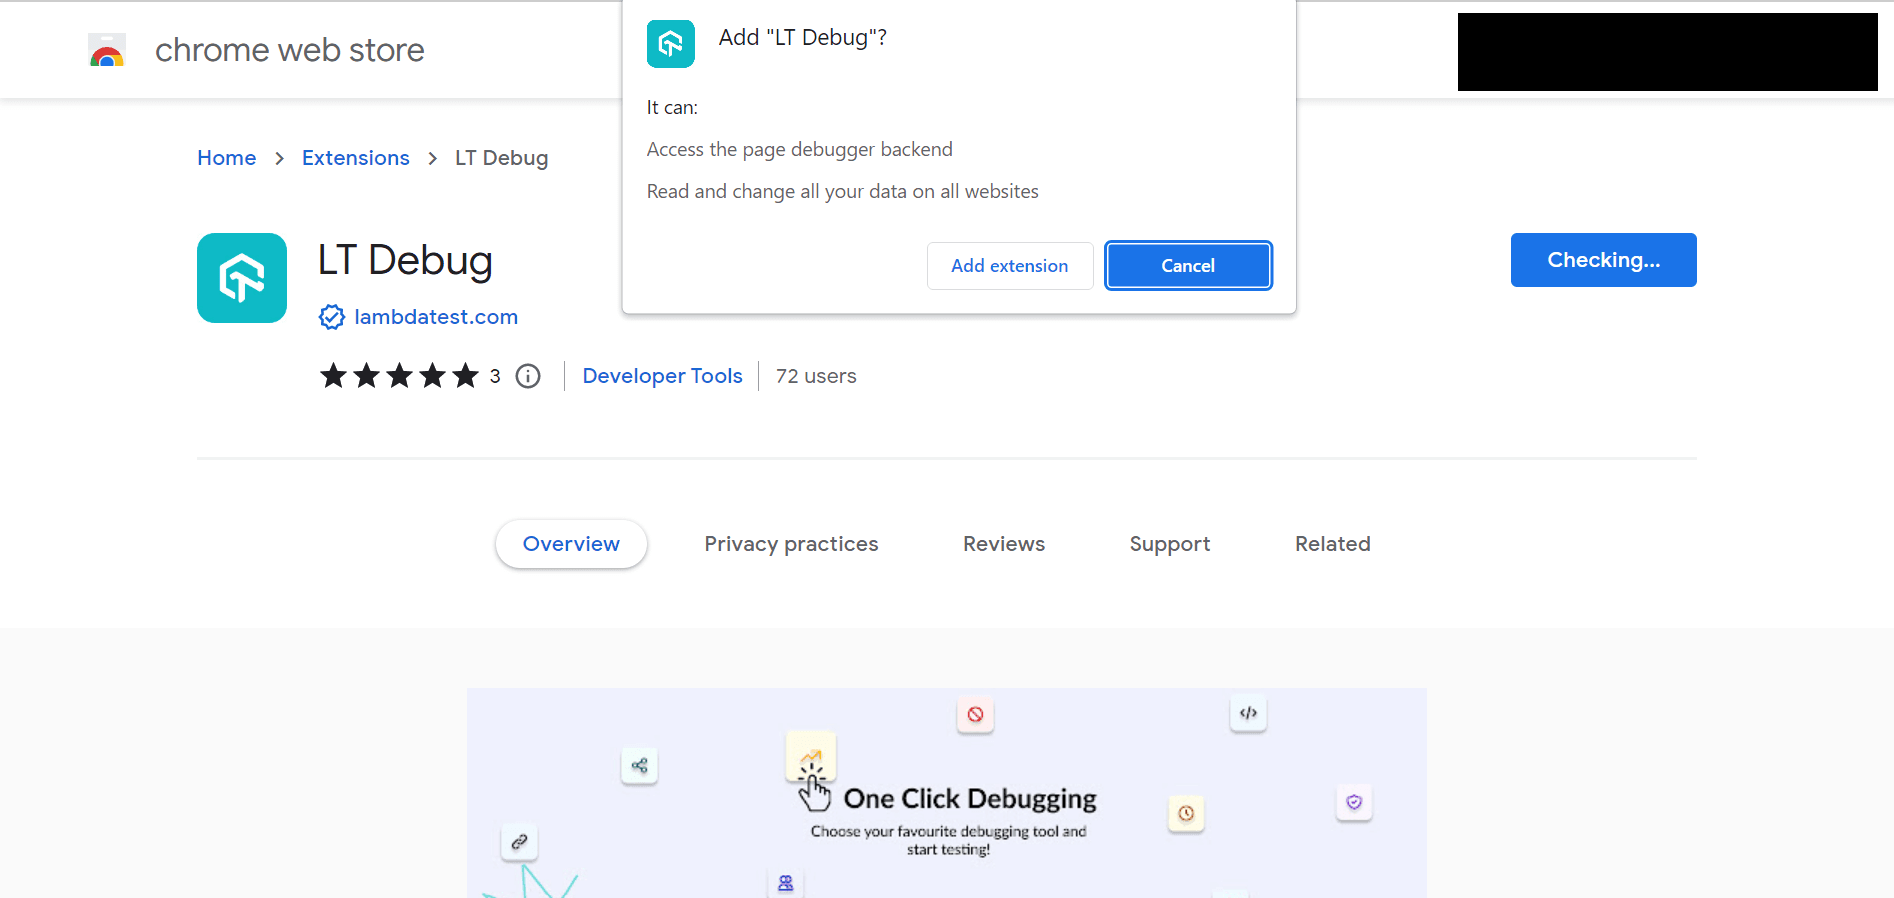
Step 3: All done! Now, you can choose the feature you want to add and debug.
Here is a gist of how to debug mobile browsers with our developer tools:
Subscribe to the LambdaTest YouTube channel to learn more about cross browser compatibility, real time testing, and responsiveness testing.
Top features of LT Debug
So far, we have nine features for our most loved tribe of testers and developers. Let’s take you through a tour:
Add/Modify Headers
With this feature, you can add, remove or modify the header, be it a request header or a response header. This way, you can easily test a header for a website request.
How to do it?
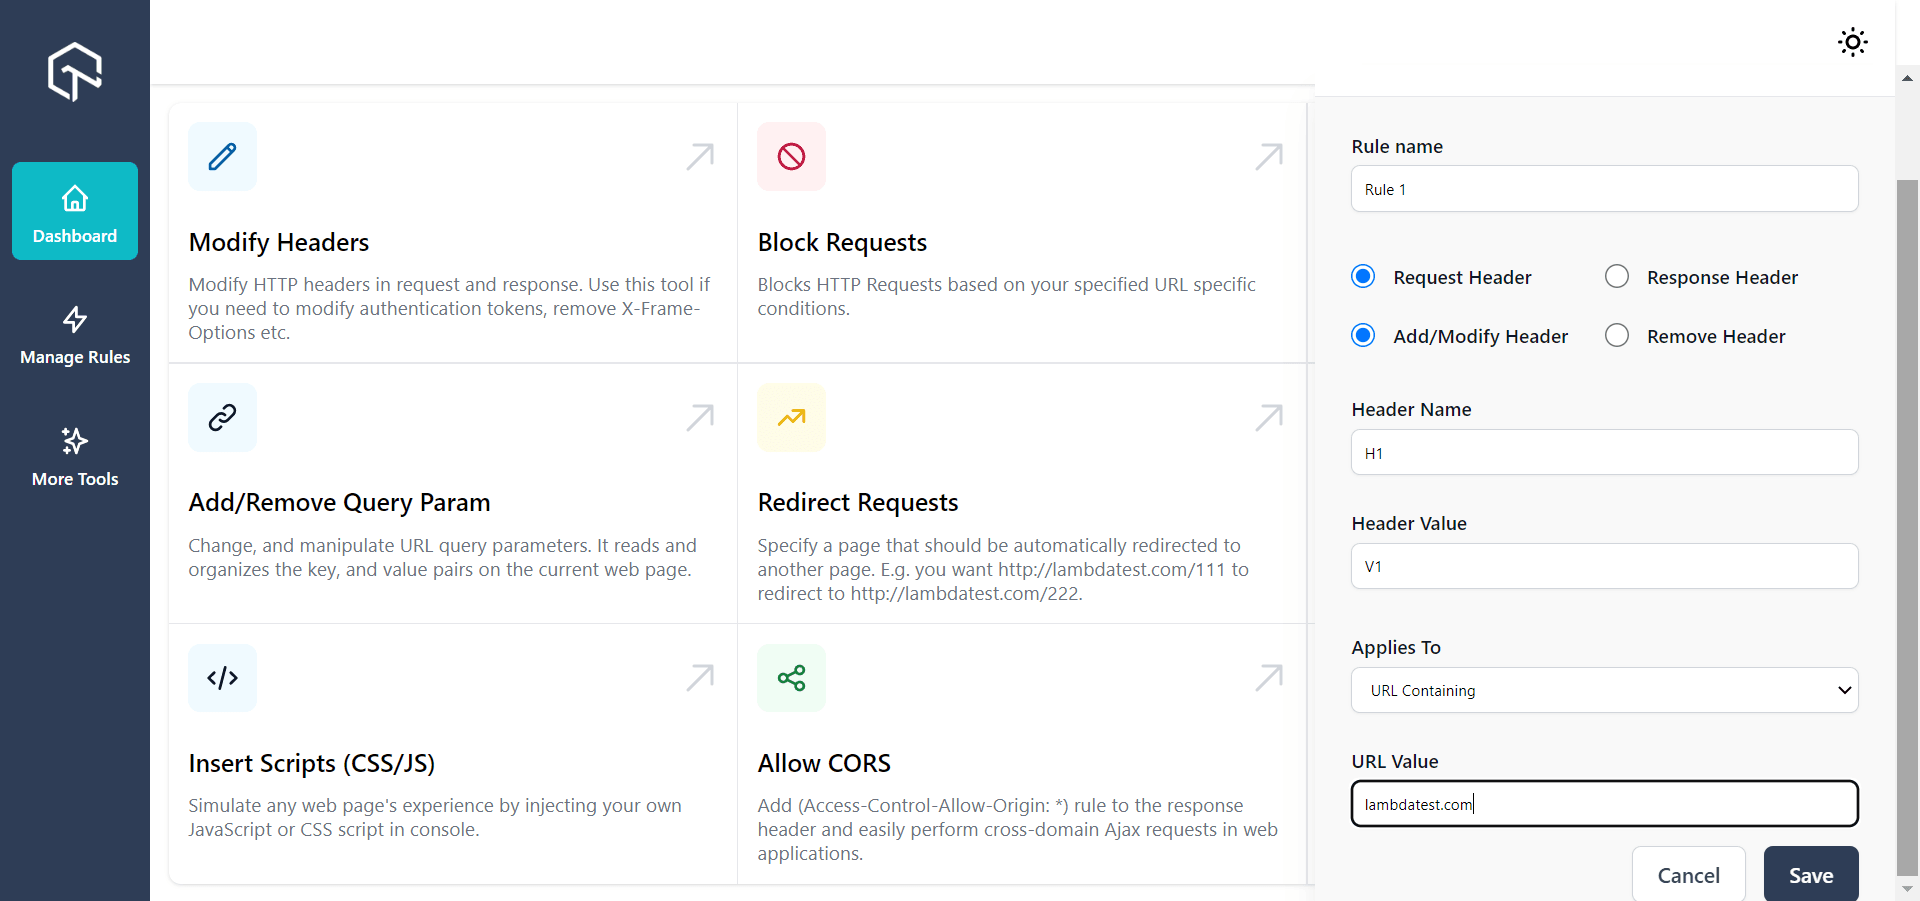
Step 1: Click on Modify Headers. Provide the needed values to modify the request header. Input the URL value and click Save.
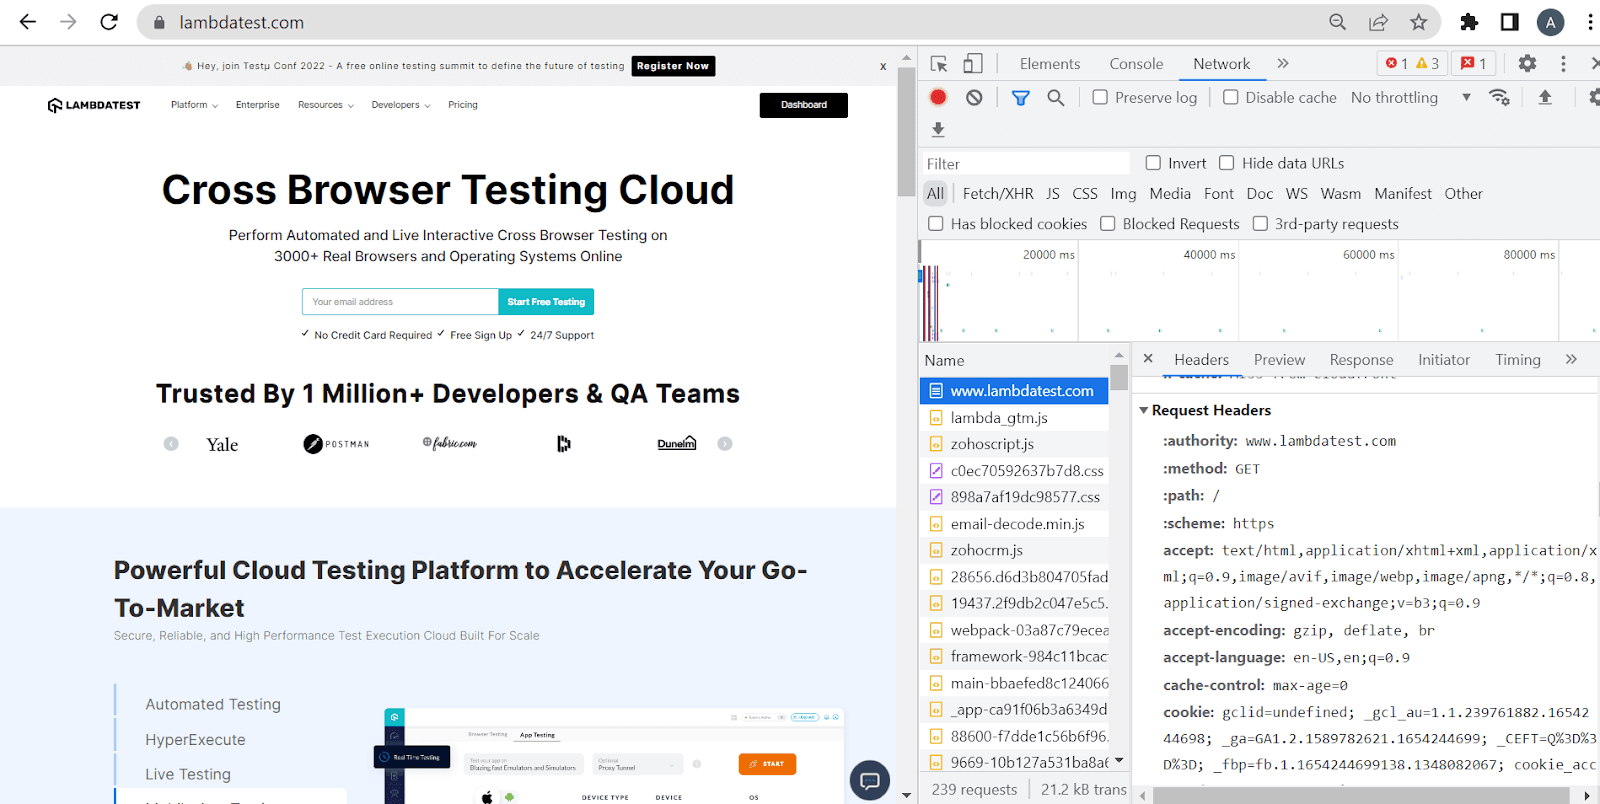
Step 2: You can directly notice that the changes have been implemented on the request header value by clicking on the three dotted lines at the right corner of the screen of your Chrome browser. Go to More tools -> Developer tools-> Network-> Headers and click on the website source you need to test.
Block Requests
LT Debug offers a feature to block HTTP requests based on your specific URL filter conditions. With this feature, you can easily filter URL requests as and when you like.
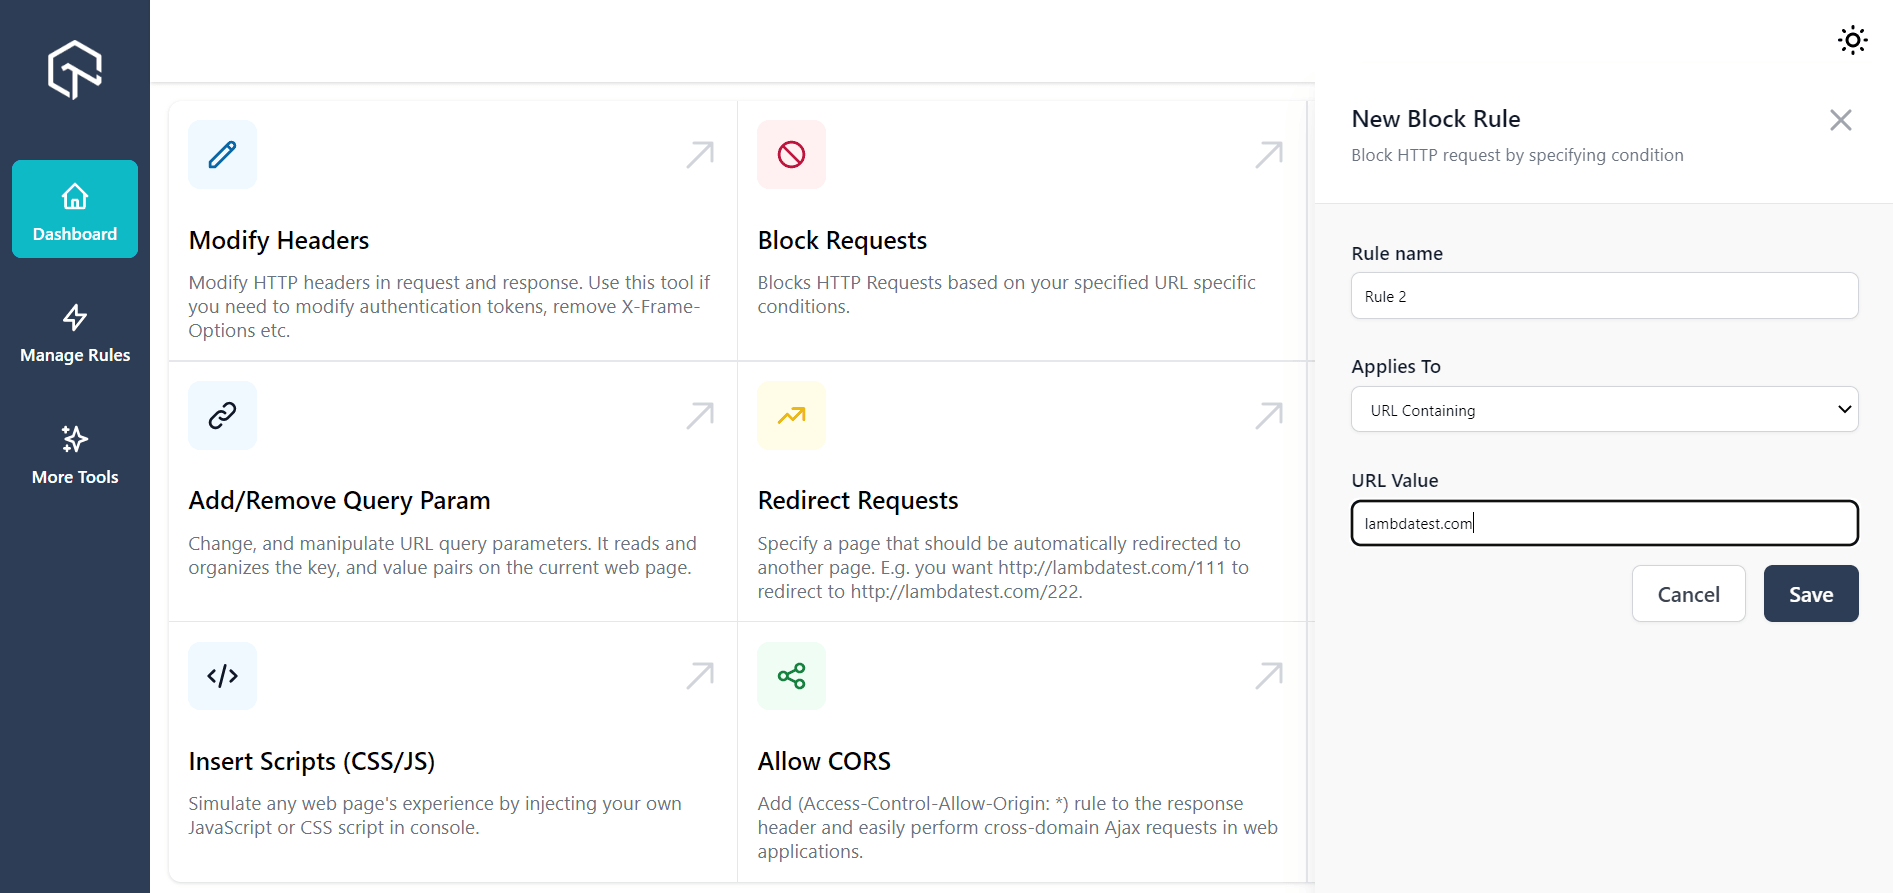
Step 1: Go to Block Requests. Type the exact URL or URL with a specific word. E.g: For lambdatest.com, you can just provide lambdatest. That would suffice. Click on Save.
Step 2: Now, the URL will have got blocked when you try to visit the website.

Throttle Response
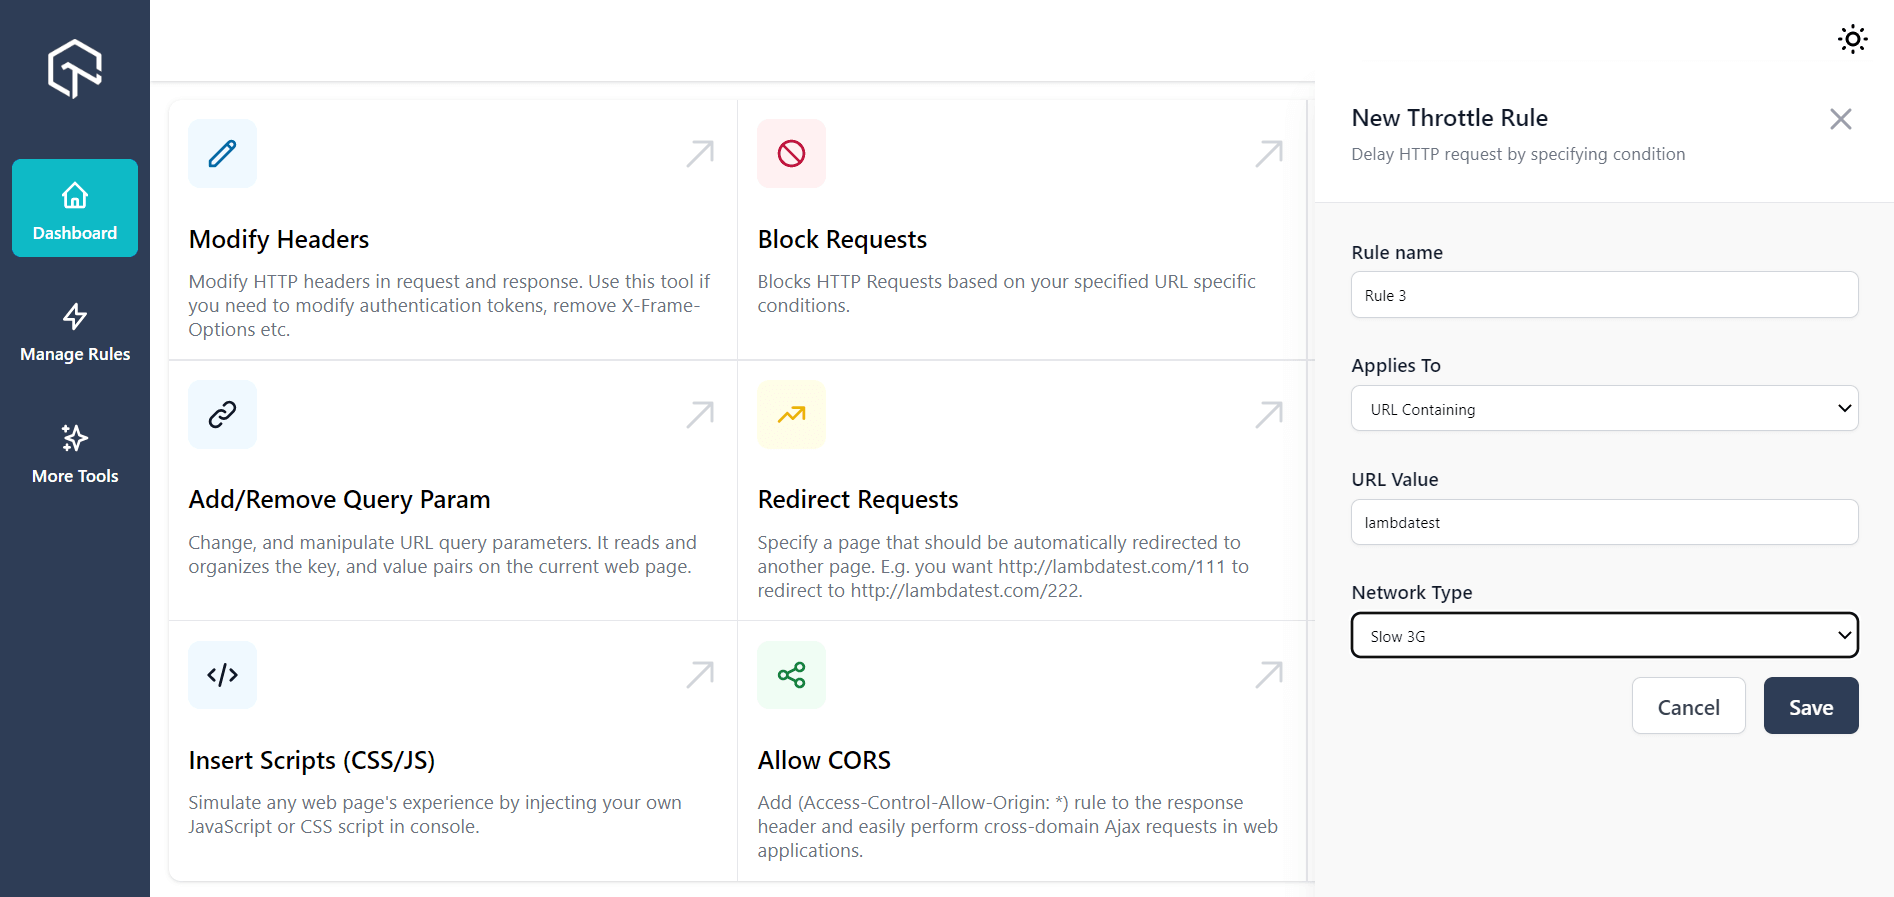
With this feature, you can efficiently perform network throttling to control network speed for every network request. Choose the URL of your choice when you want to reduce the speed or function at normal speed. You can also control if there is any millisecond delay.
Easily emulate network speed based on the use case without diving into Chrome element inspector. Not every user would have access to 4G or 5G. You can also try checking your website performance in a slow 3G network to understand how it performs in such geographical areas.
Here is how to try it:
Step 1: Open the LT Debug Chrome Extension tab. Click on Throttle Response.
Step 2: Provide your network type and URL. For example, you can try slow 3G.
Step 2: You can check for the performance under Slow 3G by visiting the website.
Perform Network Throttling like a pro! Try LambdaTest Now!
Add/Remove Query Param
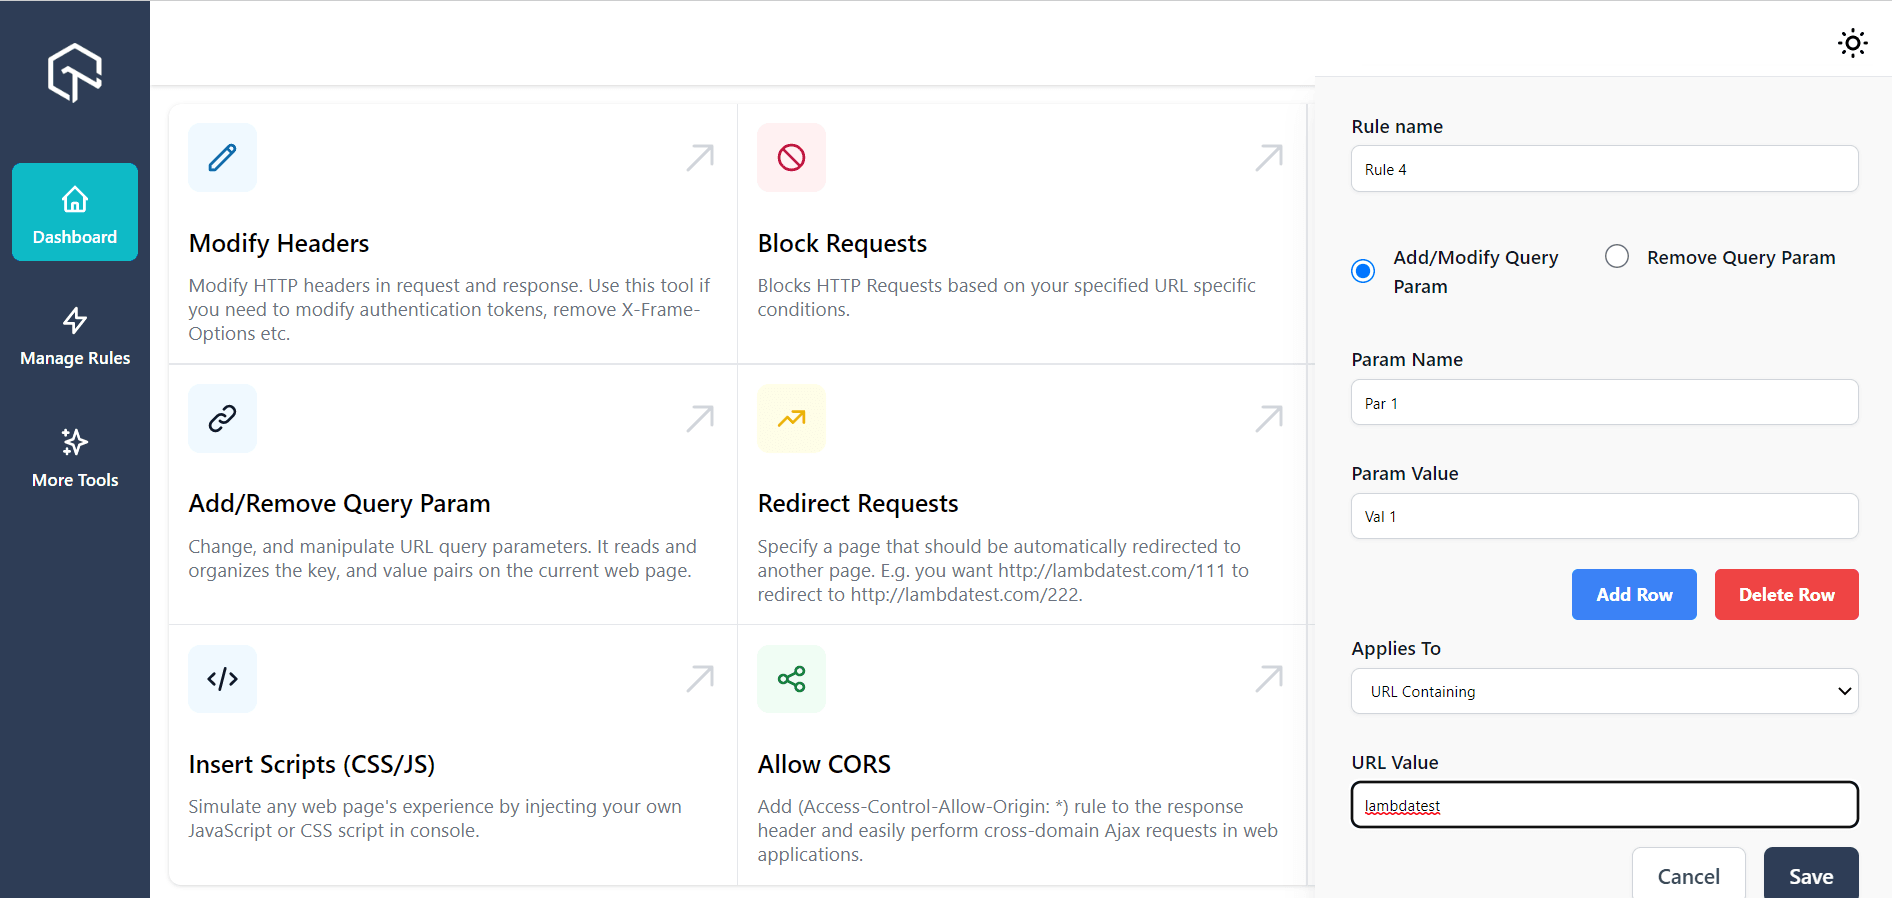
With this feature, you can simply change and modify the URL query parameters. The function of URL parameters is to read and organize the key, along with the value pairs present on the particular web page. This can simplify your debugging experience.
Step 1: Check out by adding a query param with key Param Name as Par 1 and the Param Value as Val 1 to URLs containing the word “lambdatest”. This will redirect you to the needed page whenever you visit the URL with the value “lambdatest” in it.
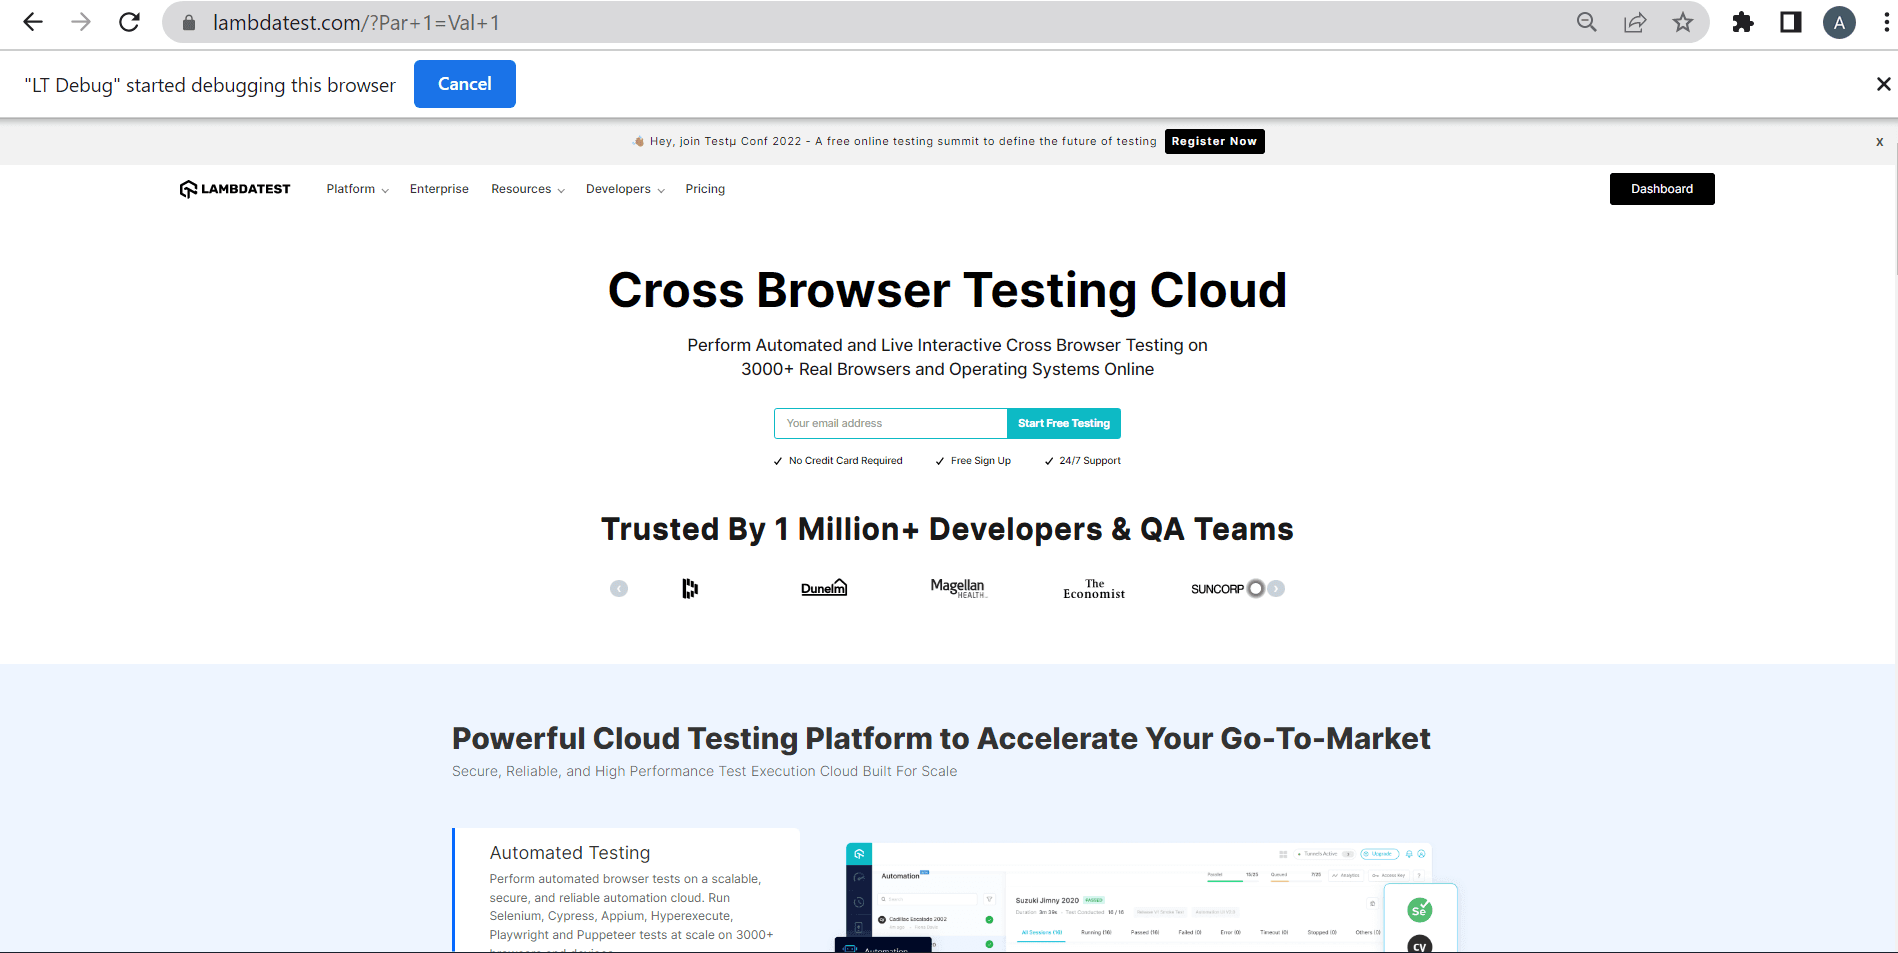
Step 2: Visit lambdatest.com to witness the changes reflected on the query parameter, right from the header.
Redirect Requests
Use the redirect request tool when you want to configure a URL to redirect them to your preferred web URL.
Step 1: Provide the URL value that needs to be changed to the URL value where you need to redirect it.
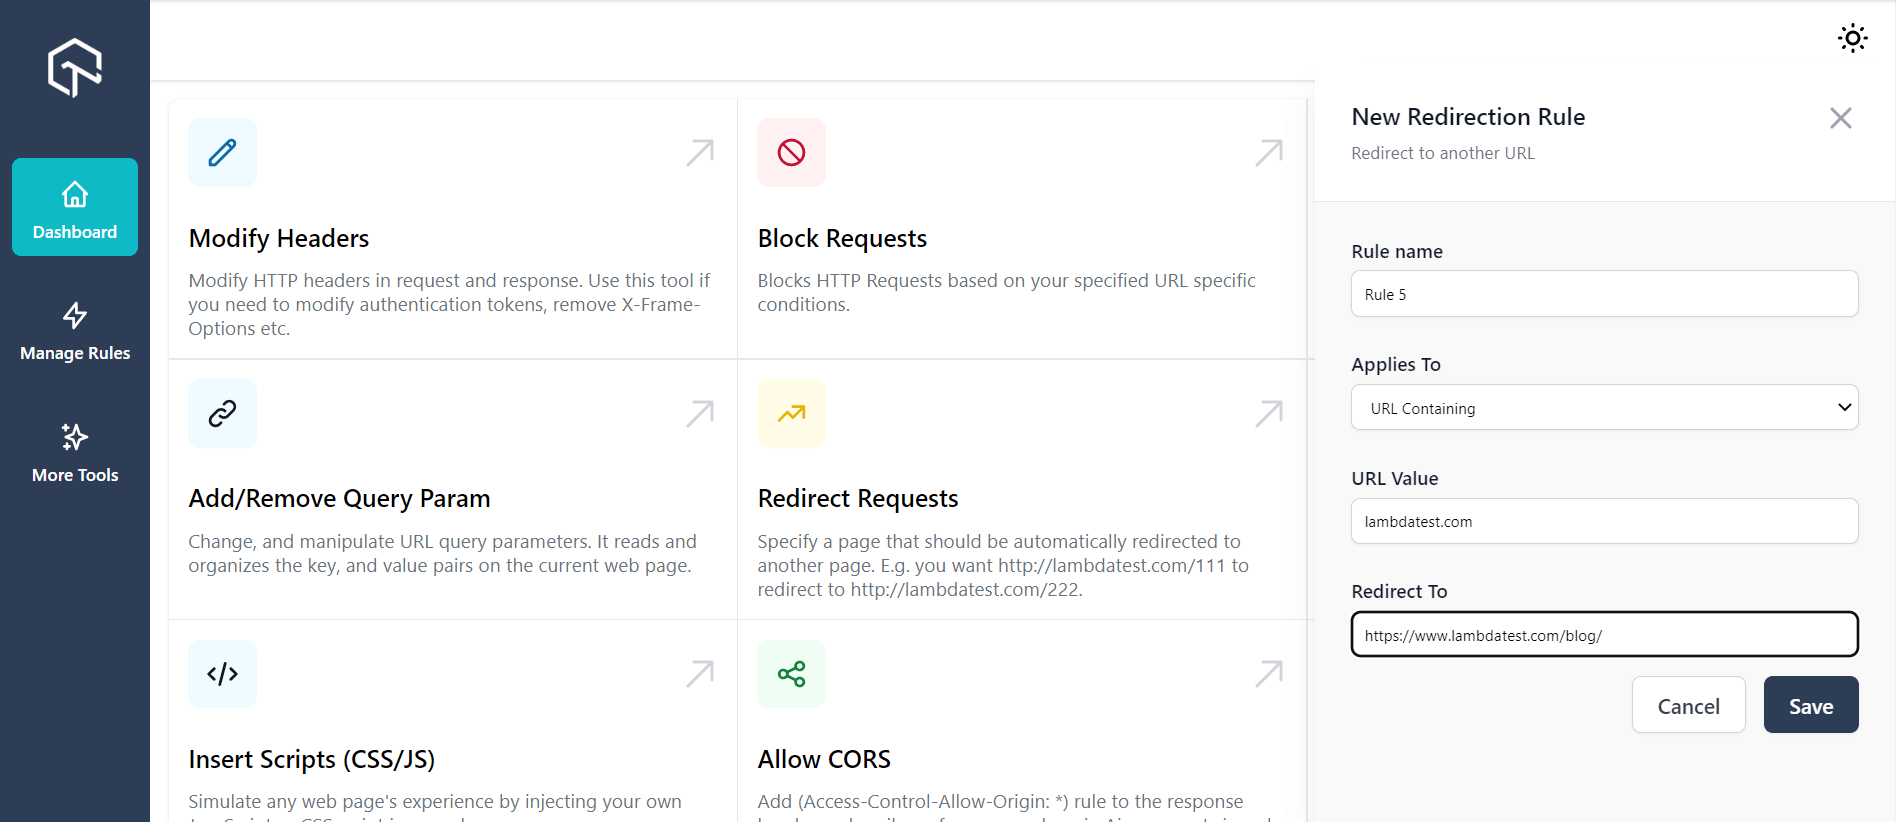
Step 2: You can see that when you try to visit lambdatest.com, you are redirected to lambdatest.com/blog.
Change User Agent
Are you in need of cross browser testing? You can easily switch between different user-agent strings in a faster manner. Simulate, imitate and spoof different browsers, devices and search engine spiders according to your choice.
Step 1: For instance, let’s test our website on the Chrome browser on Windows 10. You can also check for the user agent by More tools -> Developer tools-> Network-> Headers. Scroll down to find the user agent at the end.
This is the user agent: Mozilla/5.0 (Windows NT 10.0; Win64; x64) AppleWebKit/537.36 (KHTML, like Gecko) Chrome/103.0.0.0 Safari/537.36 [ip:37.163.61.154]
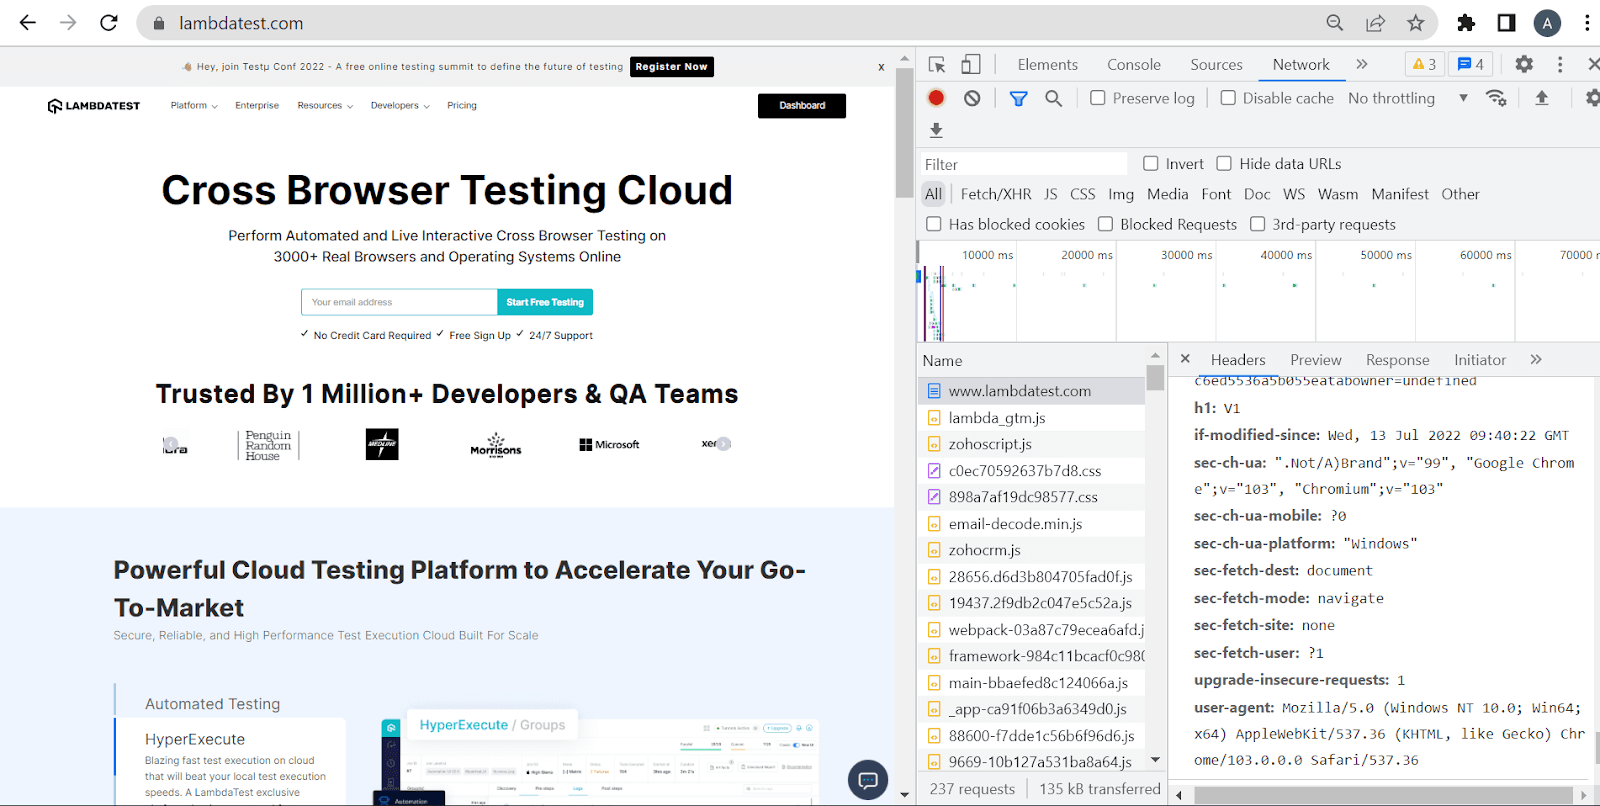
Step 2: Let’s say you want to test on Internet Explorer 8 on Windows XP.
Here is the user agent: Mozilla/4.0 (compatible; MSIE 8.0; Windows NT 5.1; Trident/4.0).
All you need to do is provide the user agent string of the browser and OS in the form.
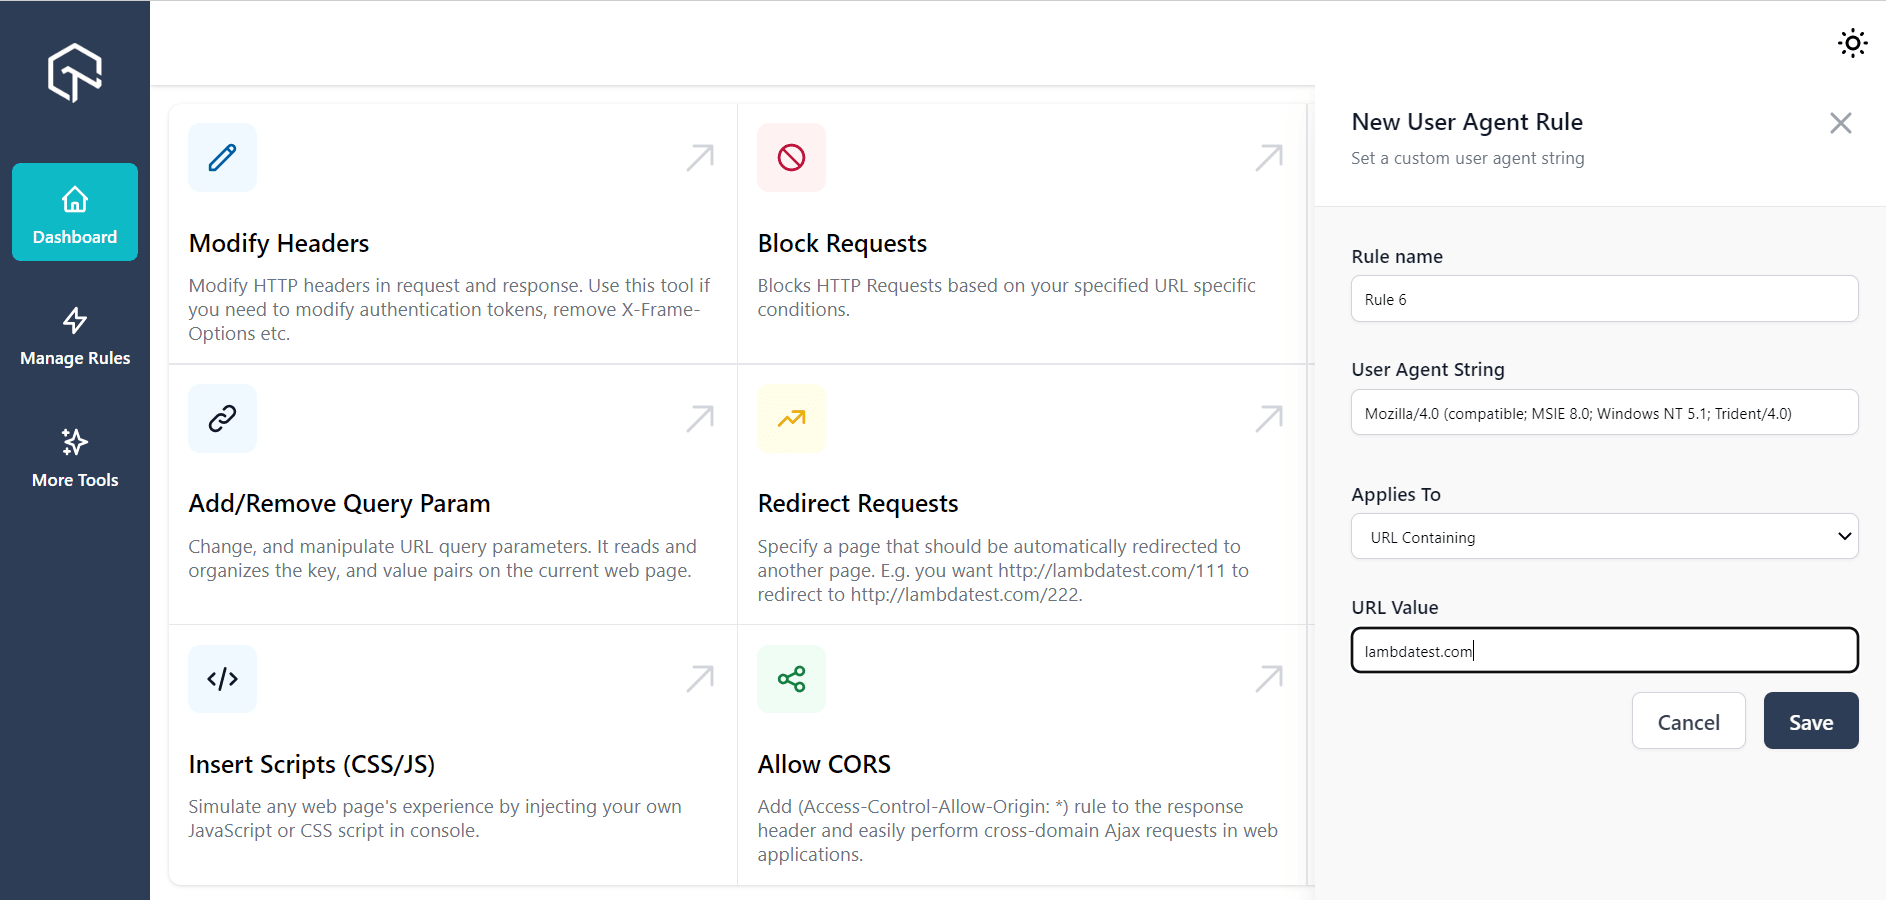
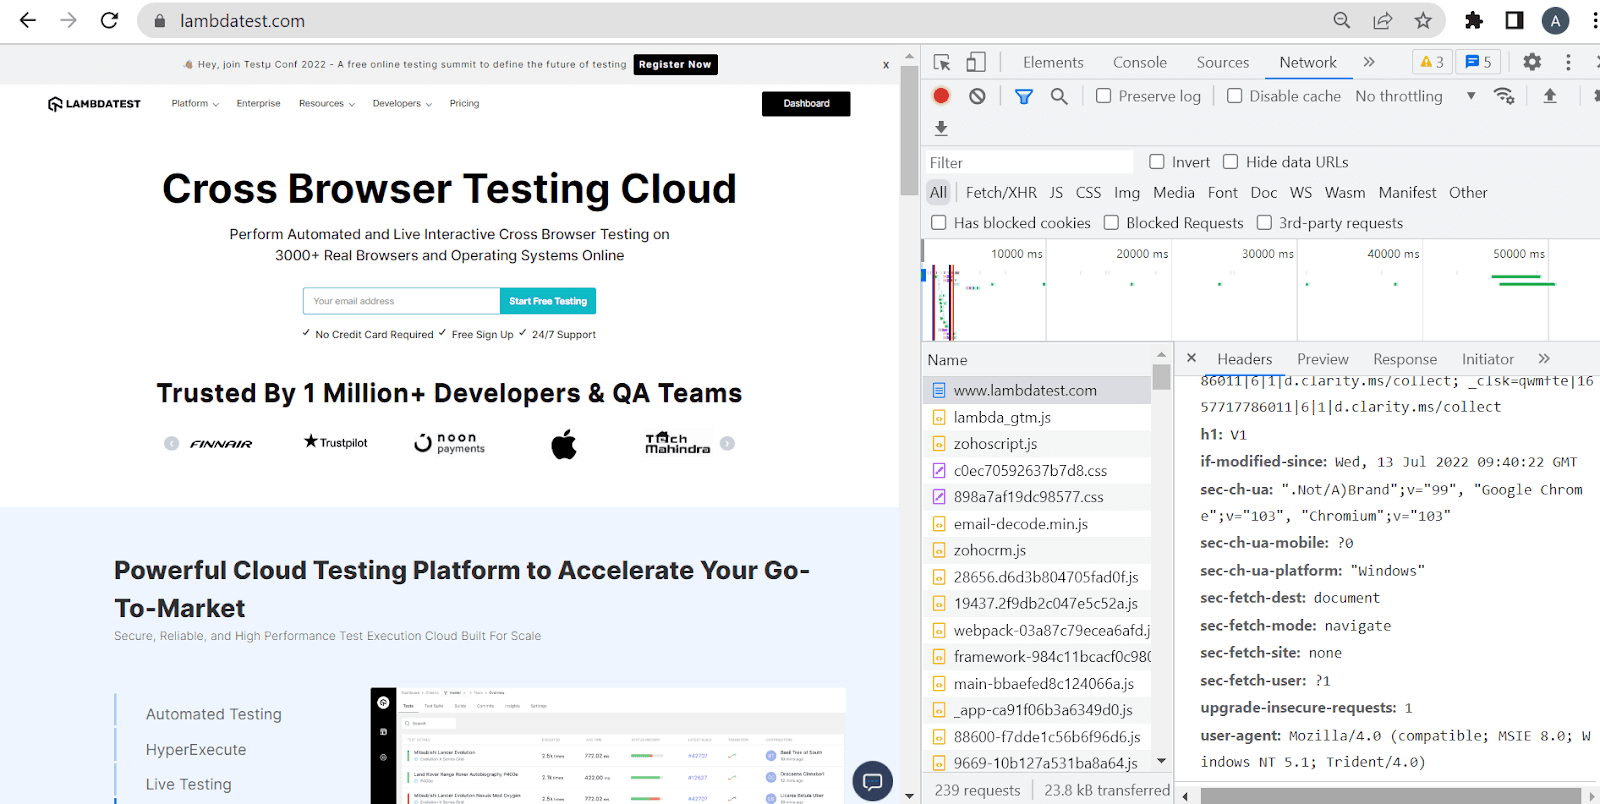
Step 3: Now, perform the same mentioned in Step 1 to check if the user agent is reflected. Bingo! It has indeed been reflected on the page. Now you can perform cross browser testing just by entering the user agent string. No need to code or write a test script!
Insert Scripts (CSS/JS)
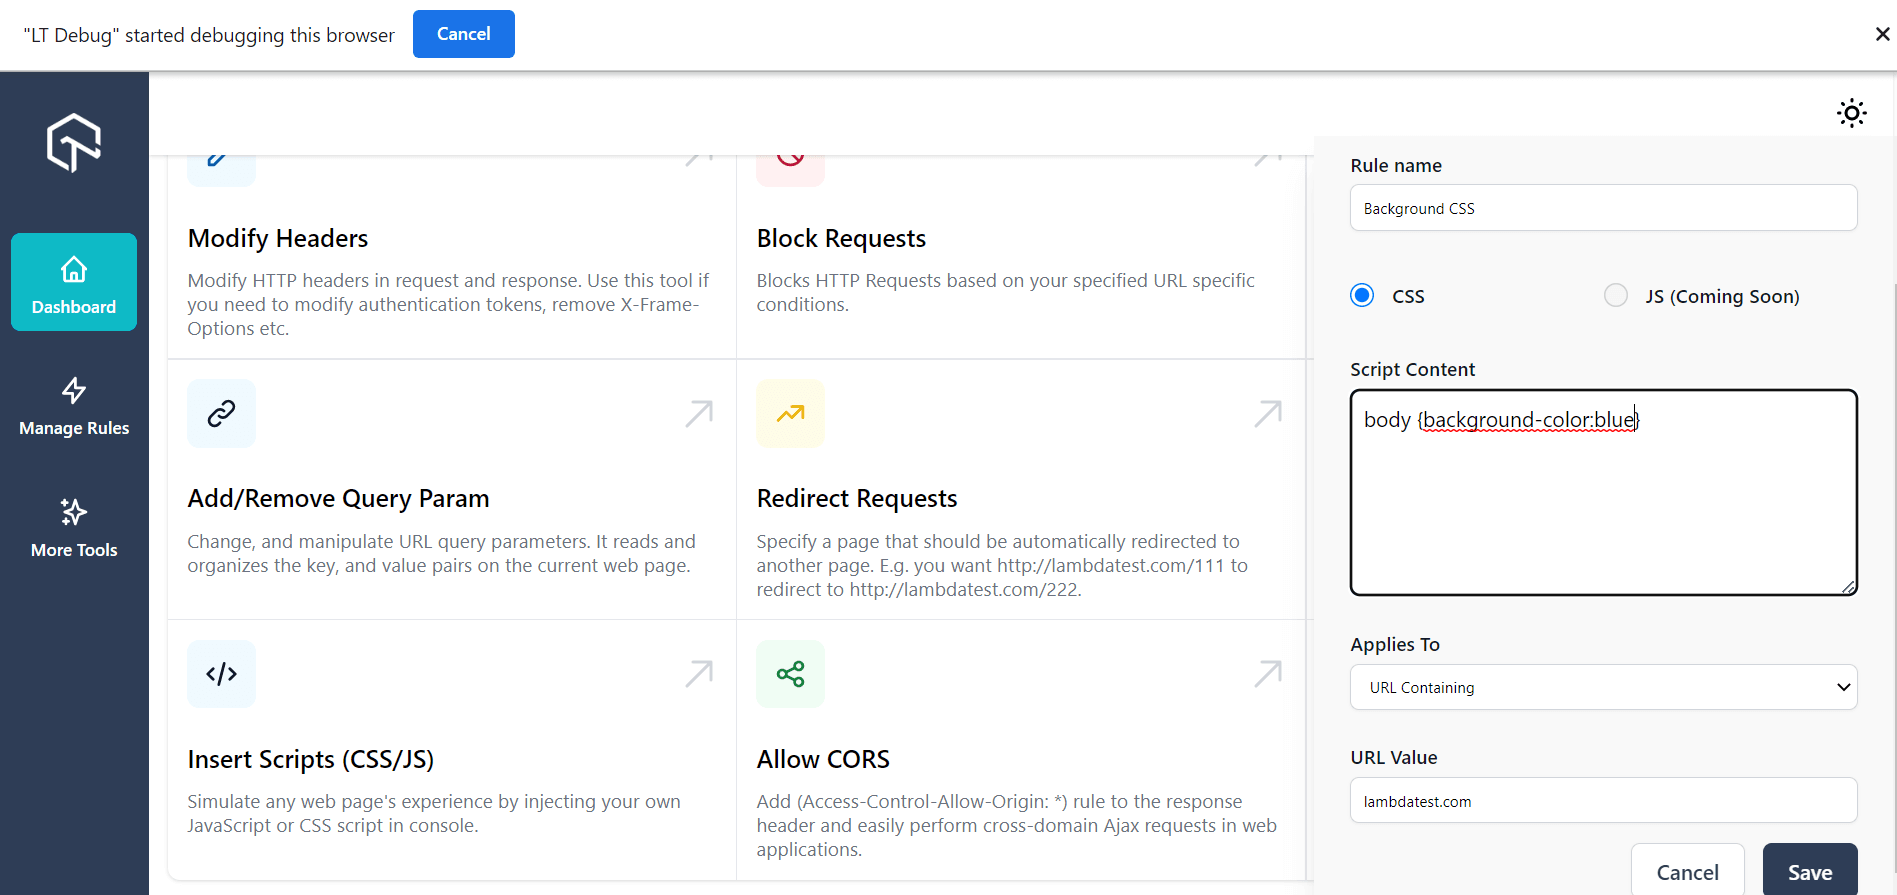
Easily simulate the web page experience as soon as you inject the CSS or JS script on your own in the console.
Step 1: Do you want to test your favorite color as the background color of your website? Let’s provide the CSS code for the same in the form:
body {background-color:blue}
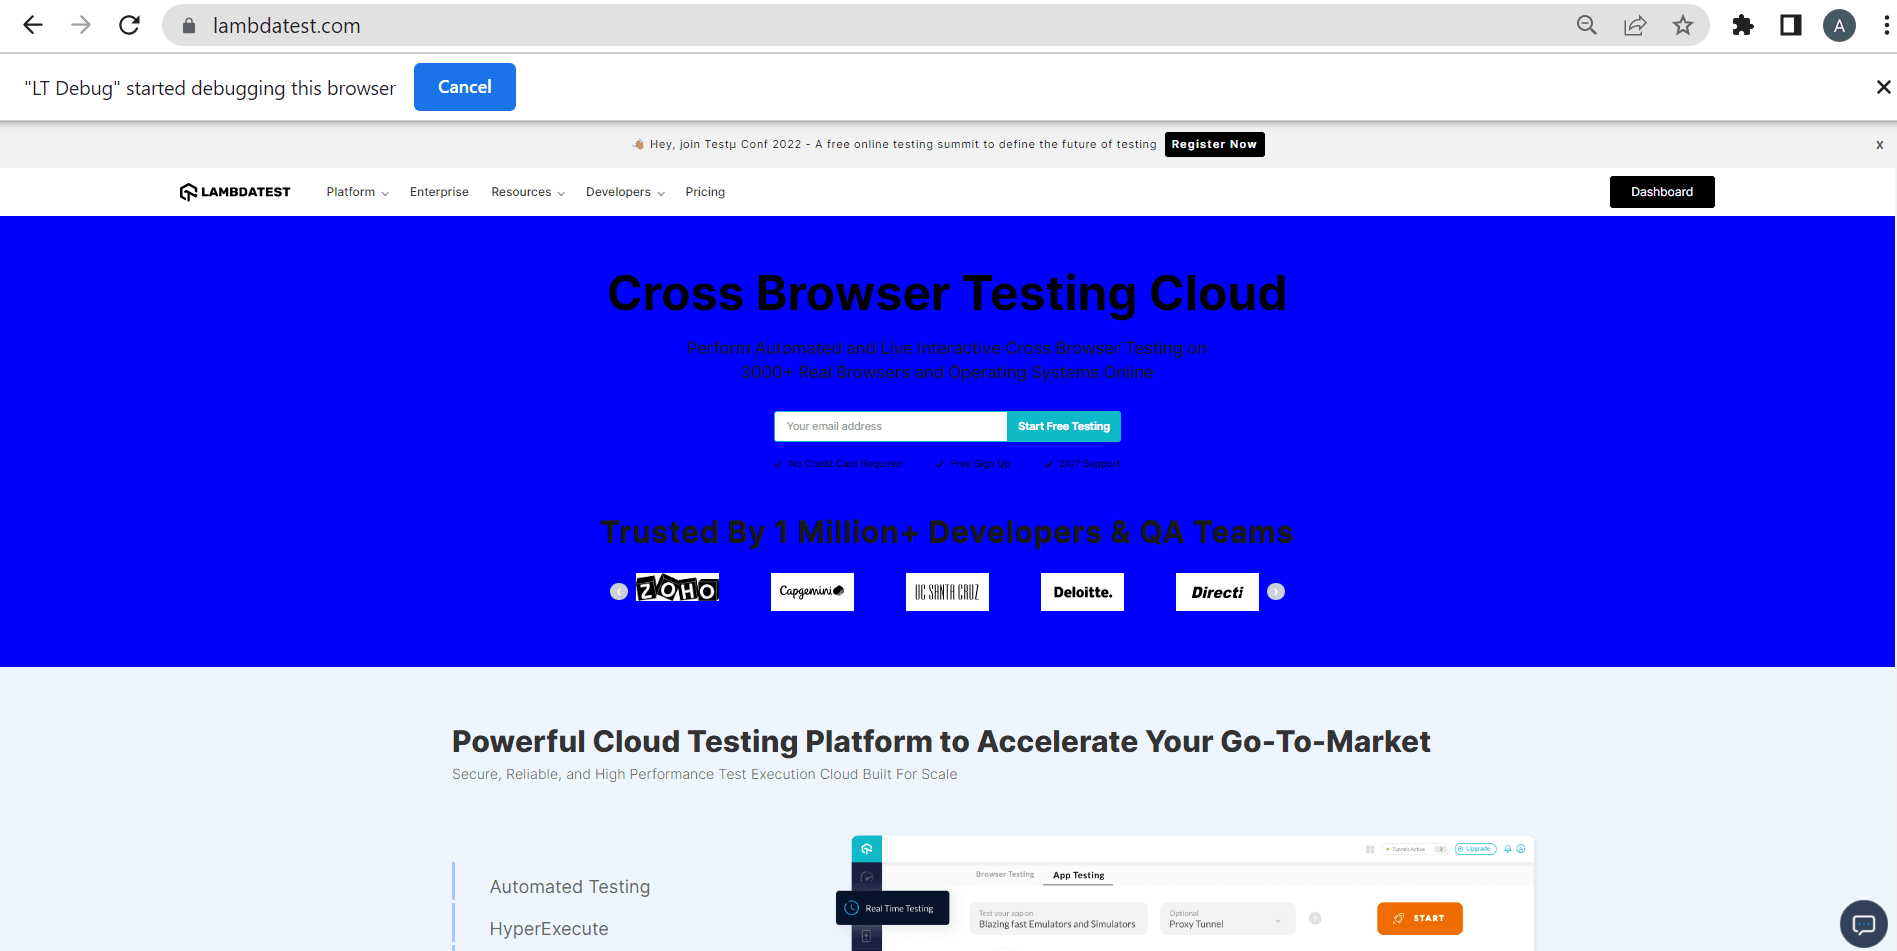
Step 2: Whiz-a-whiz! The background color has changed successfully.
Allow CORS
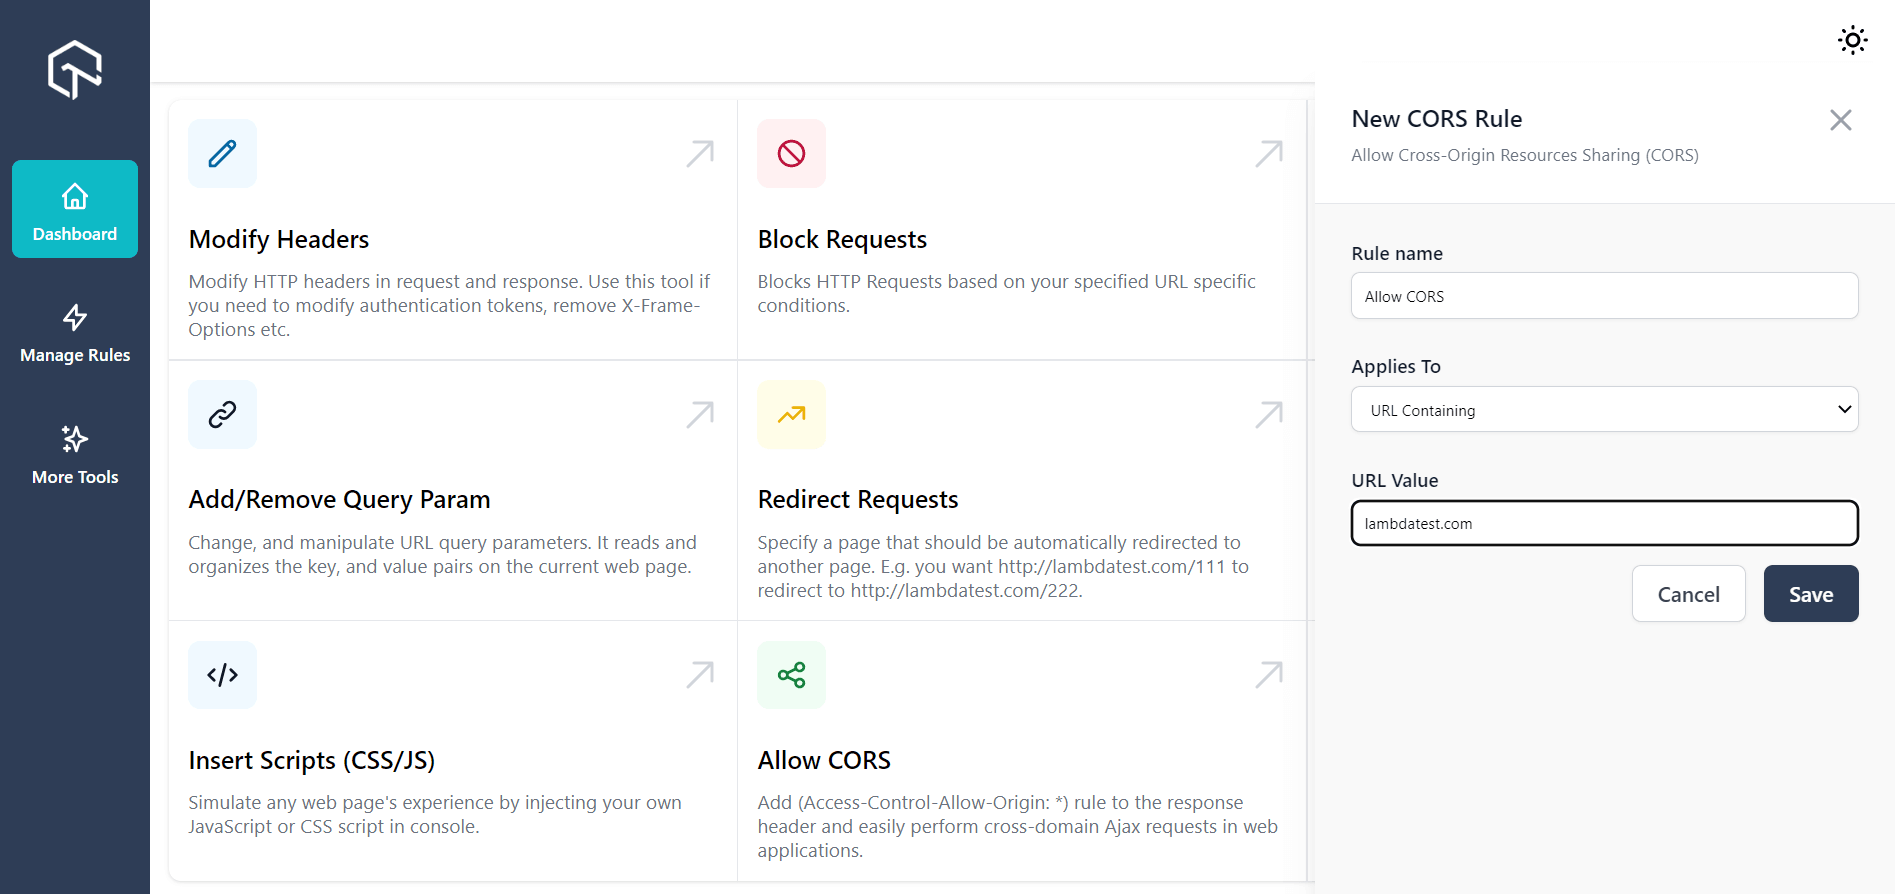
If you want to perform cross-domain Ajax requests in websites and web apps faster, all you need to do is add the (Access-Control-Allow-Origin: *) rule to your response header. For example, you can easily bypass CORS on lambdatest.com when you turn it on while accessing the resources.
Step 1: All you need to do is provide the URL value.
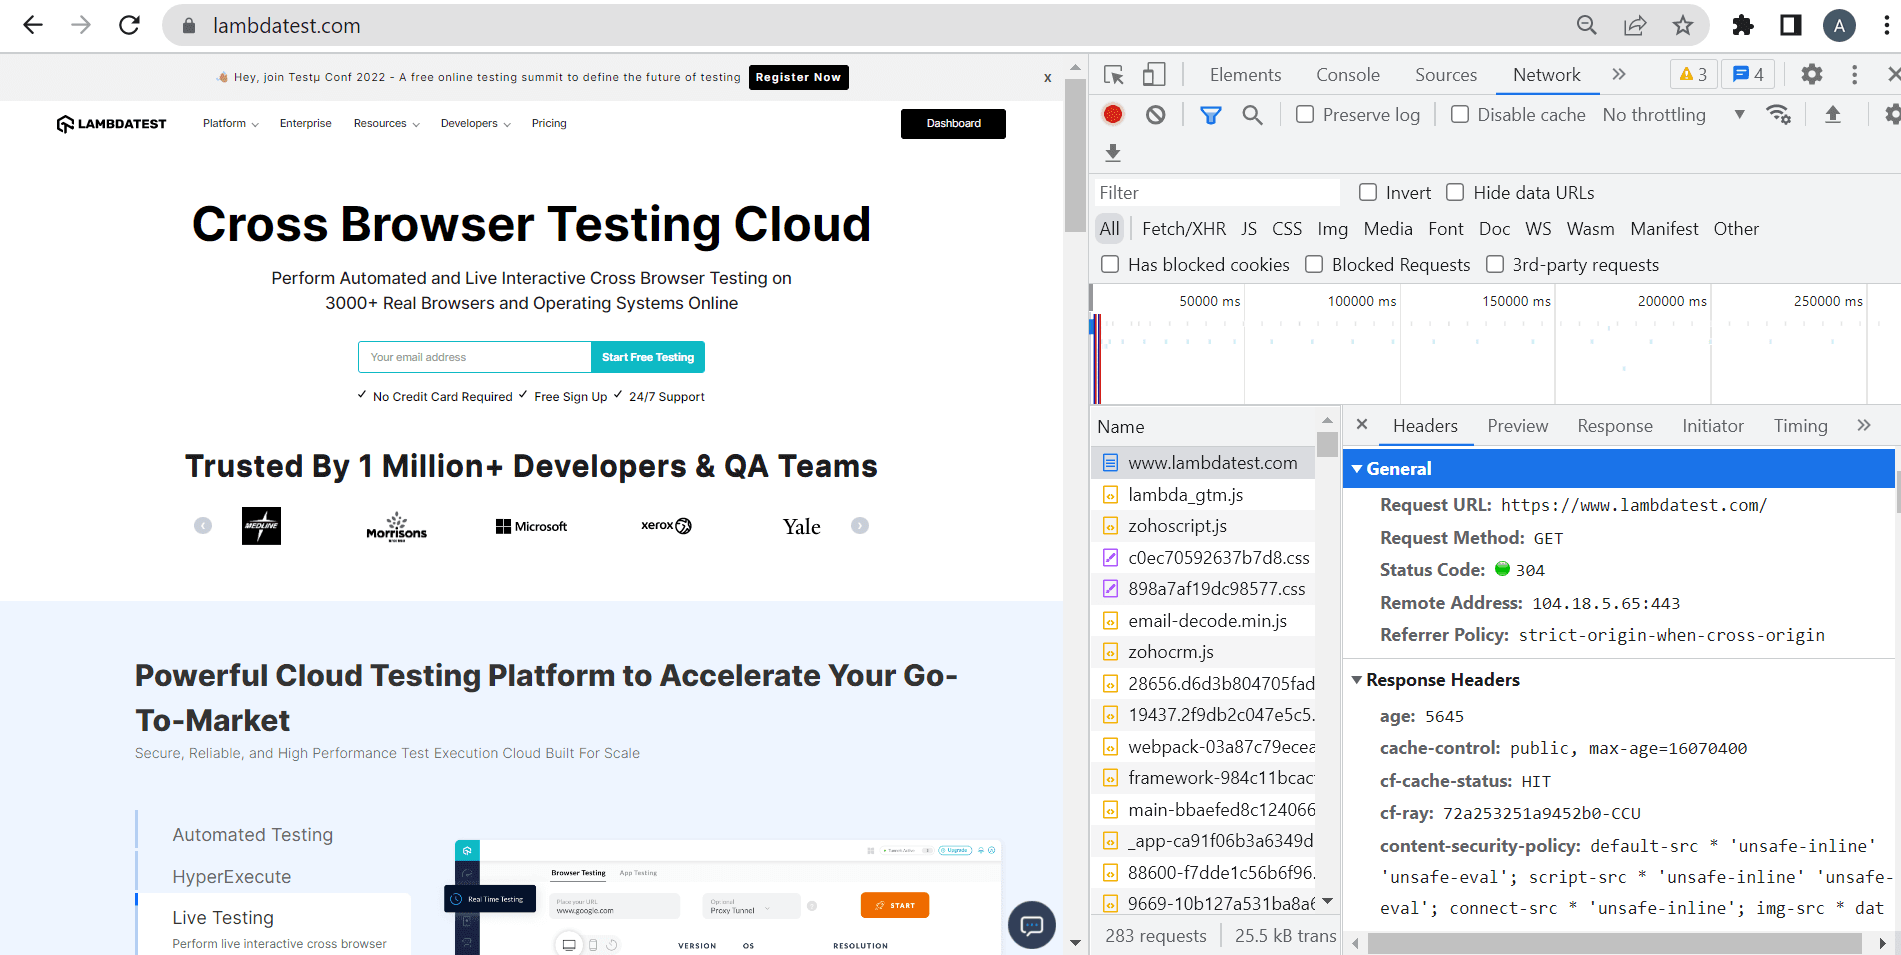
Step 2: Click on the three dotted lines at the right corner of the screen of your Chrome browser. Go to More tools -> Developer tools-> Network-> Headers to check if the rule has been implemented on the response header.
Content Security Policy
This feature allows you to remove the content security policy header on any website/web page of your choice.
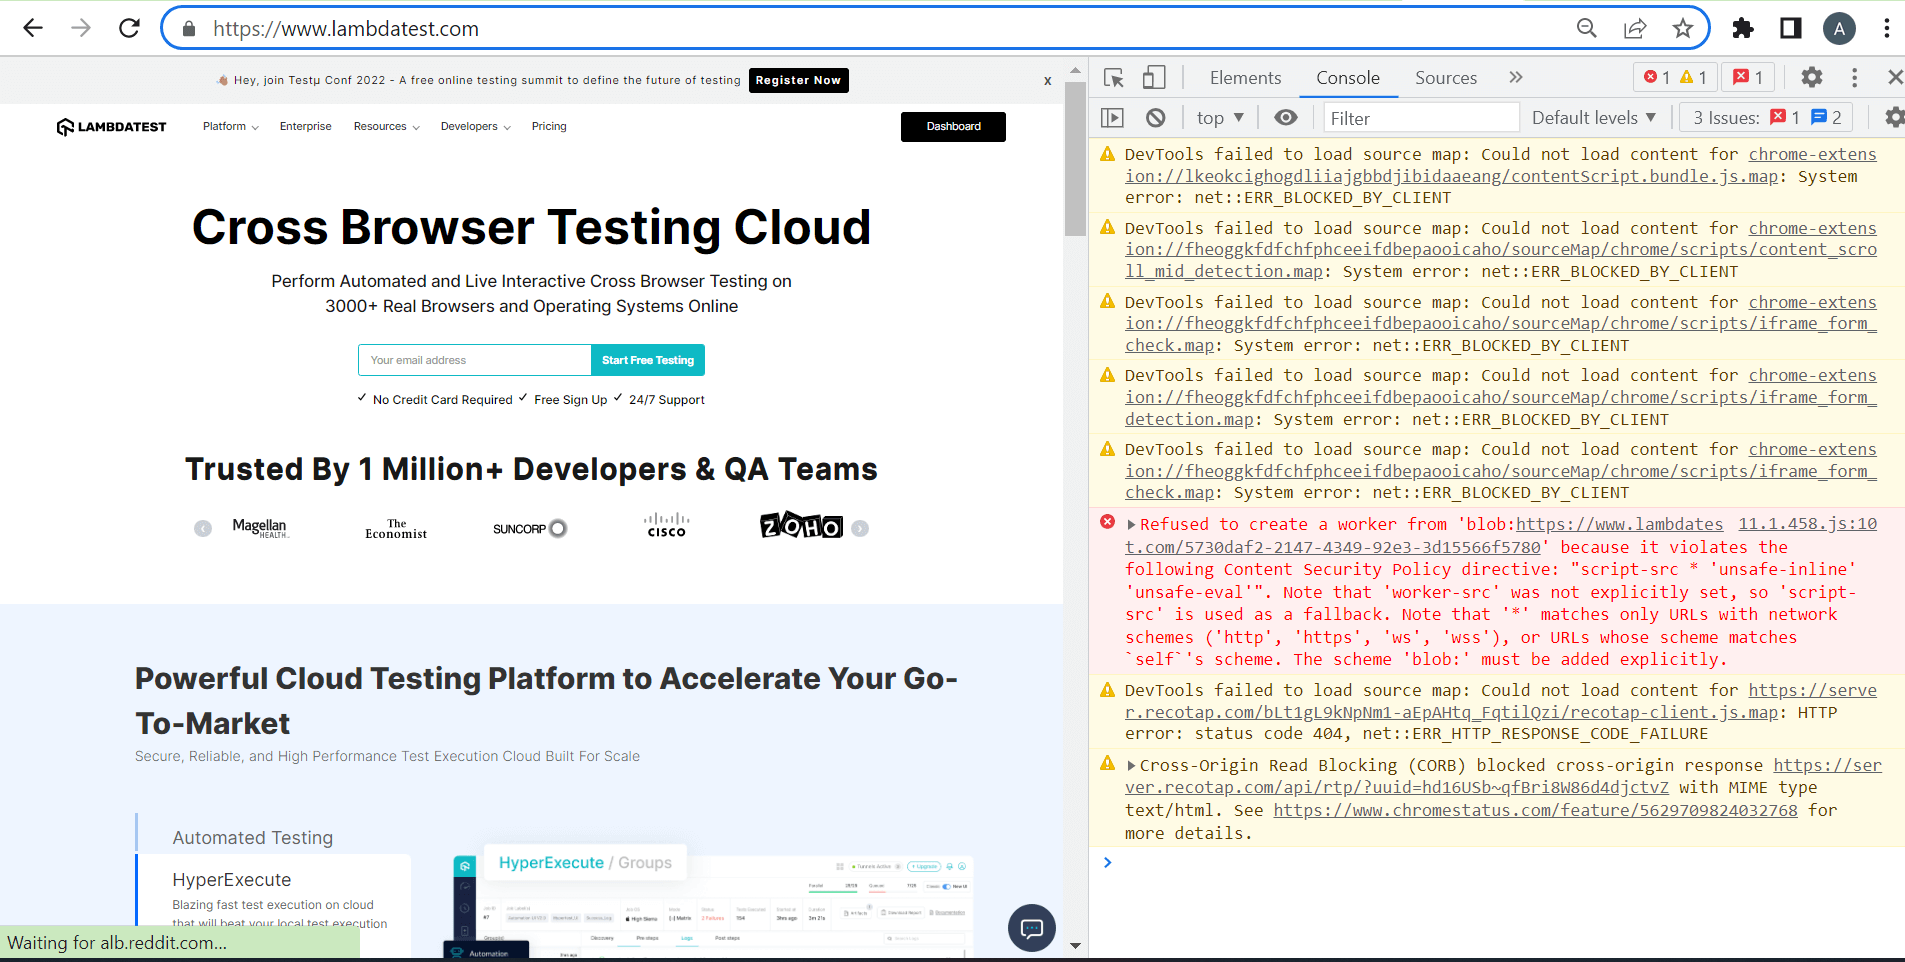
Step 1: Click on the three dotted lines at the right corner of the screen of your Chrome browser. Go to More tools -> Developer tools-> Console. You can see that there is a content blocker due to security policy violations.
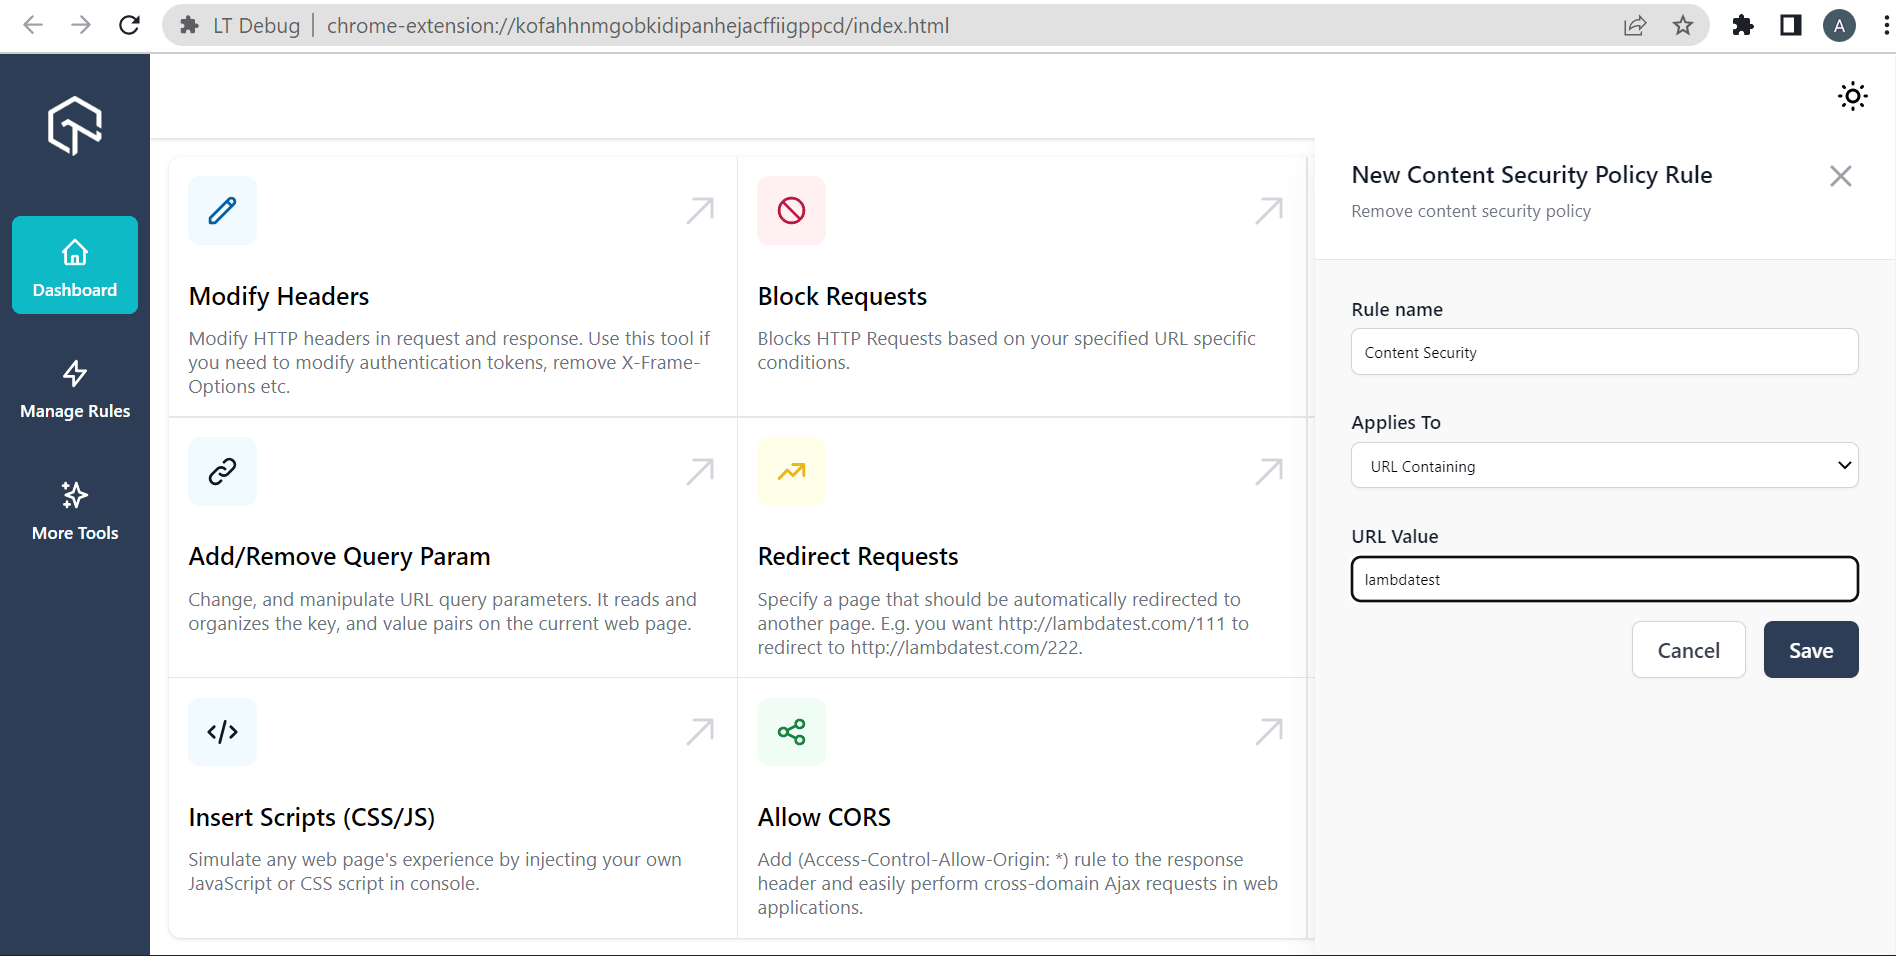
Step 2: Click on Content Security Policy. Provide the URL value where you need to remove the content blocker.
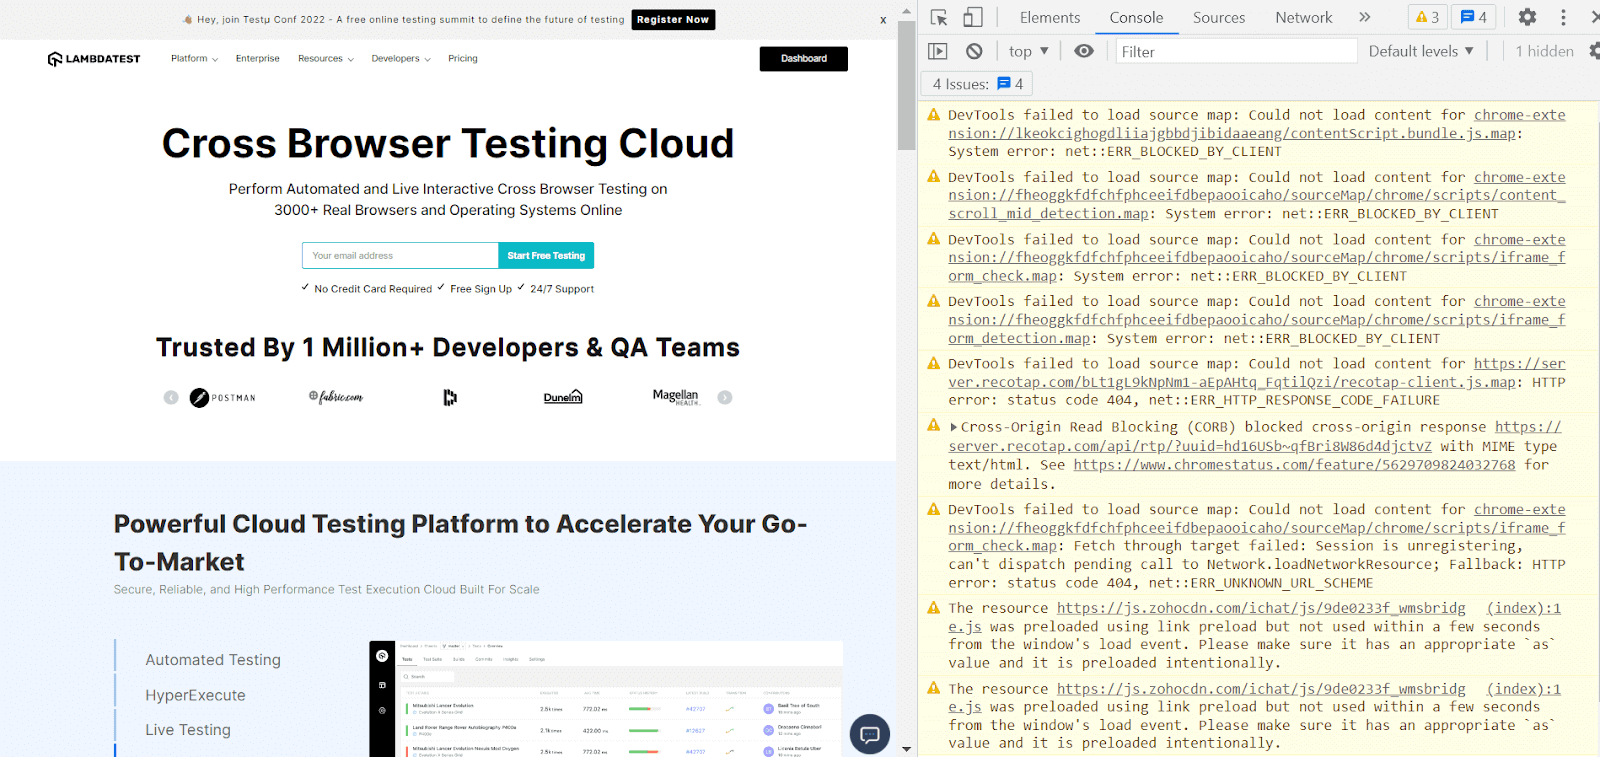
Step 3: Now, you can again visit the Console tab to check if the blocker has been removed. In our case, it’s a yes!

Why should you use LT Debug?
Even though there are many Debugging tools in the market, the tools built with the user in mind emerge as the winner. We believe we are one among them!
Here are the top reasons to trust our LT Debug browser extension:
- It’s free of cost forever.
- All you need to do is fill out a form and complete your debugging.
- You get a link to access 100+ extensions, exclusively for developers and testers, by developers and testers.
Here is how you do it:
Step 1: Click on More Tools.
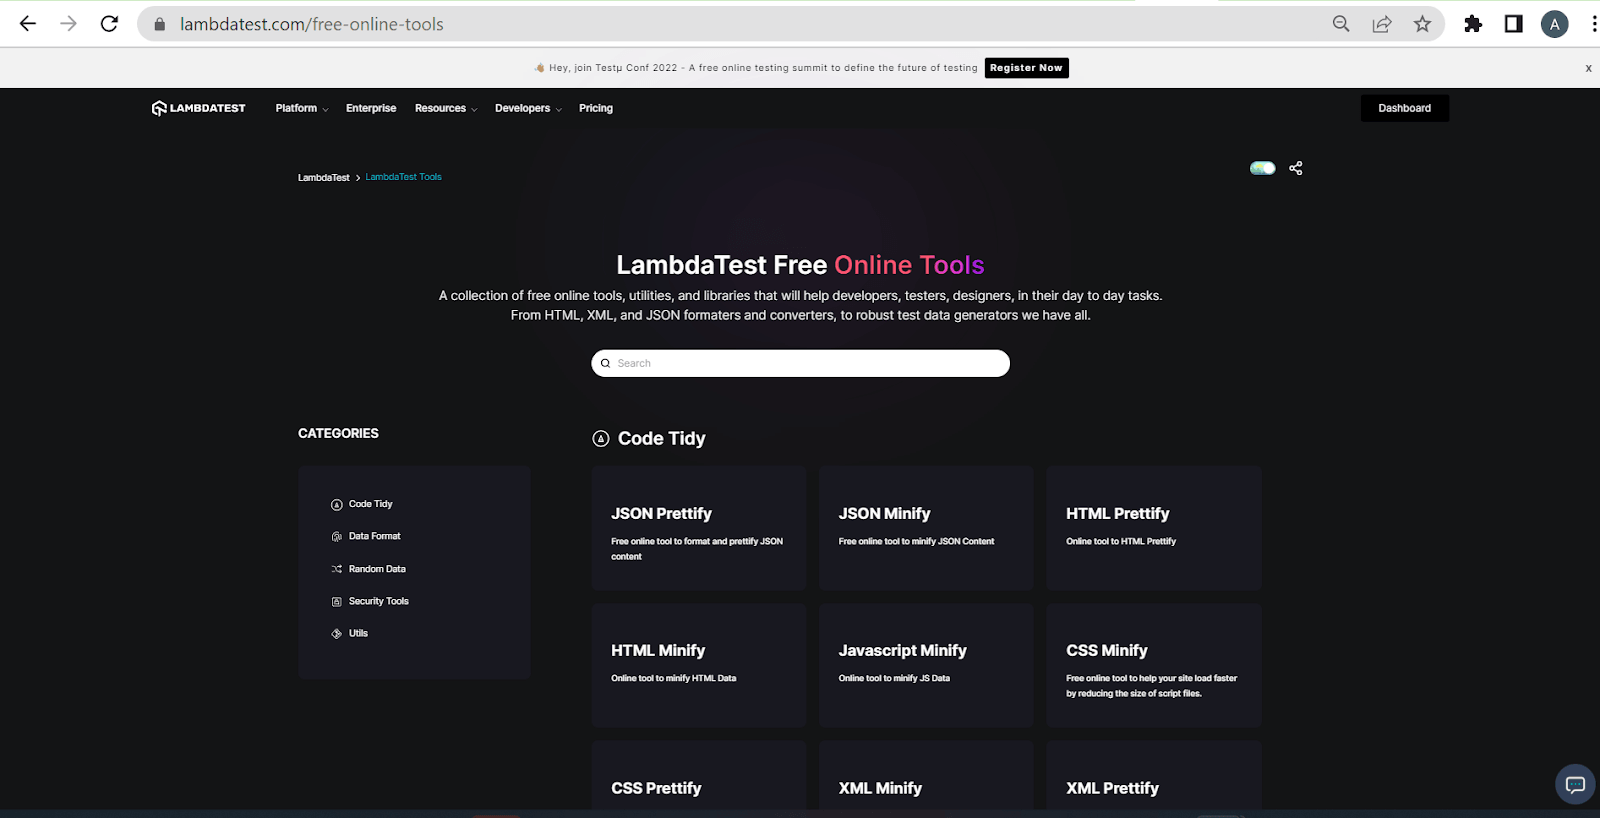
Step 2: You will be redirected to our free online tools page. Pick a tool of your choice.
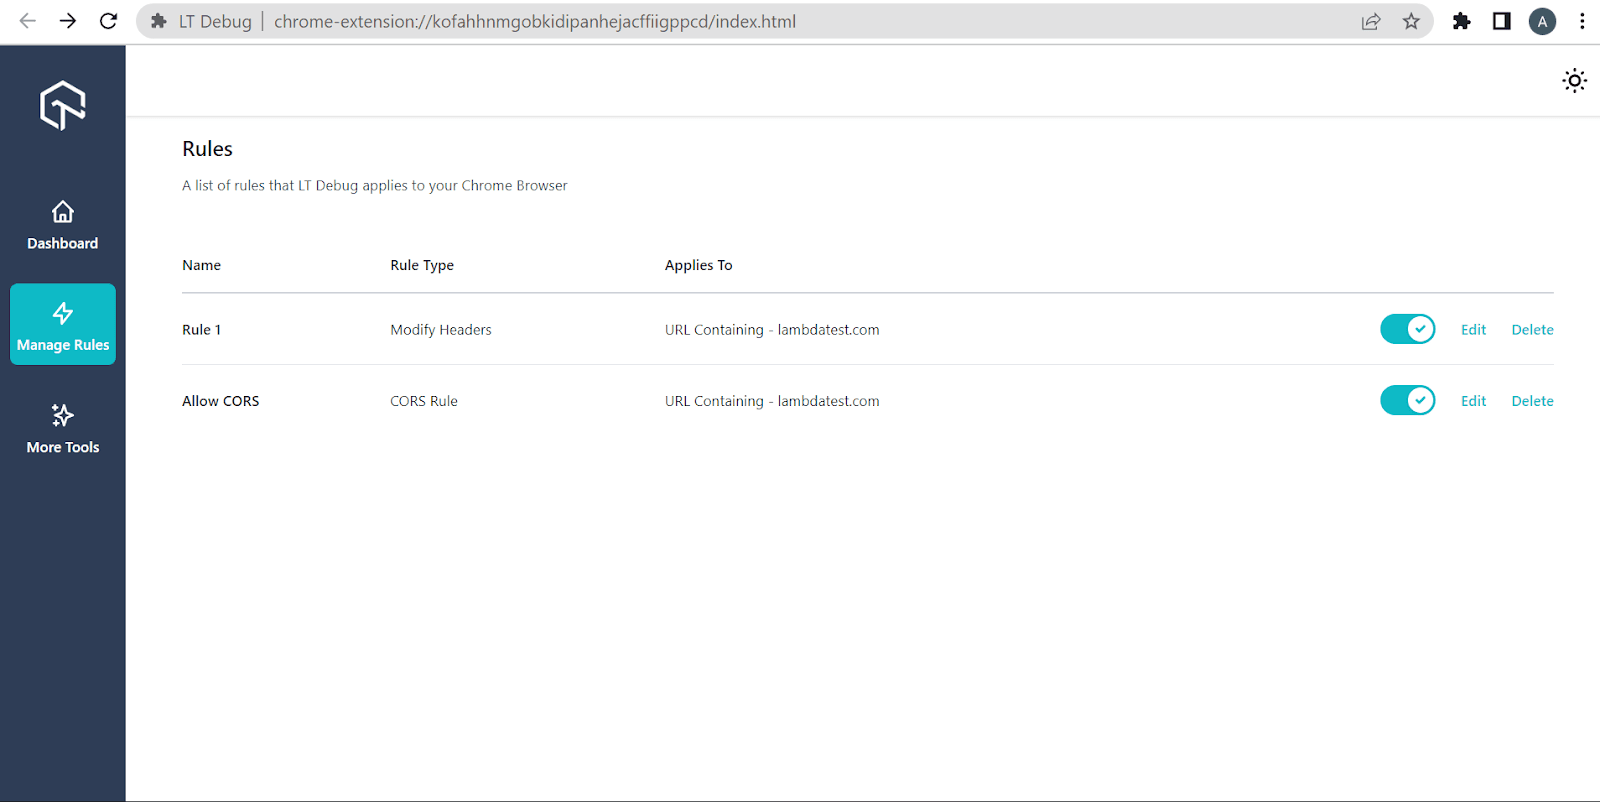
Step 3: You set the rules and break them! Go to Manage Rules to view and modify the rules.
Is there any other way to debug using LambdaTest apart from LT Debug?
Yes, of course! Follow these simple steps to debug your website using “Real Time Test”.
Step 1: Signup and Login into your LambdaTest account. Go to Real Time Testing from the left navigation menu. Choose the test configuration from a list of browsers, devices, versions, OS, screen resolution, and so on.
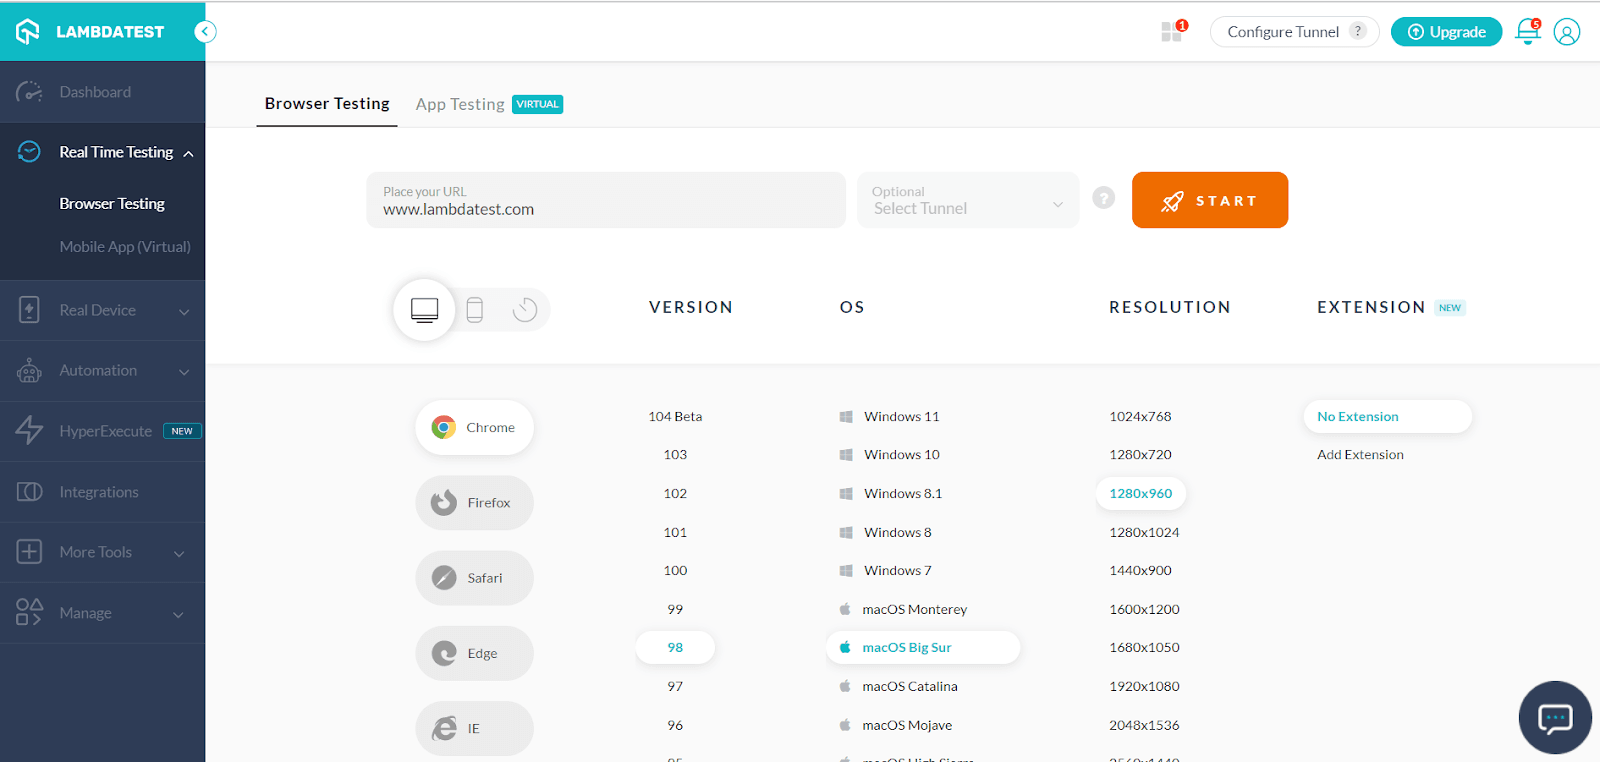
Step 2: Provide the URL of your choice.

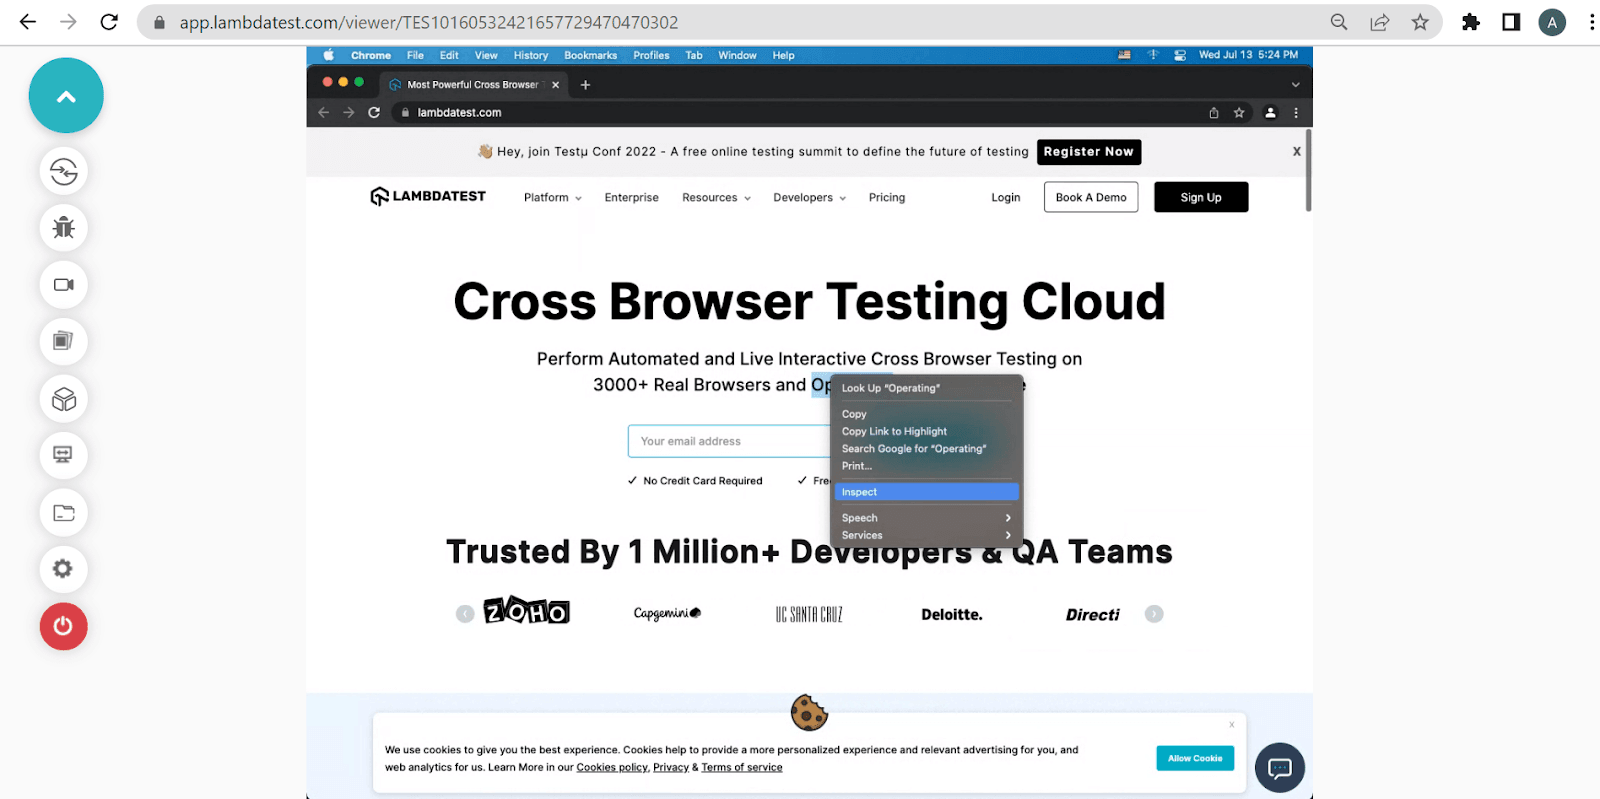
Step 3: Right-click your mouse pointer and choose Inspect.

Step 4: After that, you can inspect the website as per your needs.
Can I use LT Debug on a different browser other than Chrome?
Right now, we support only the Chrome extension. But don’t worry, we have got you covered through our online browser testing feature.
Step 1: Login to your LambdaTest account. Go to Real Time Testing from the left navigation menu. Choose the test configuration from a list of browsers, devices, versions, OS, screen resolution, and so on.
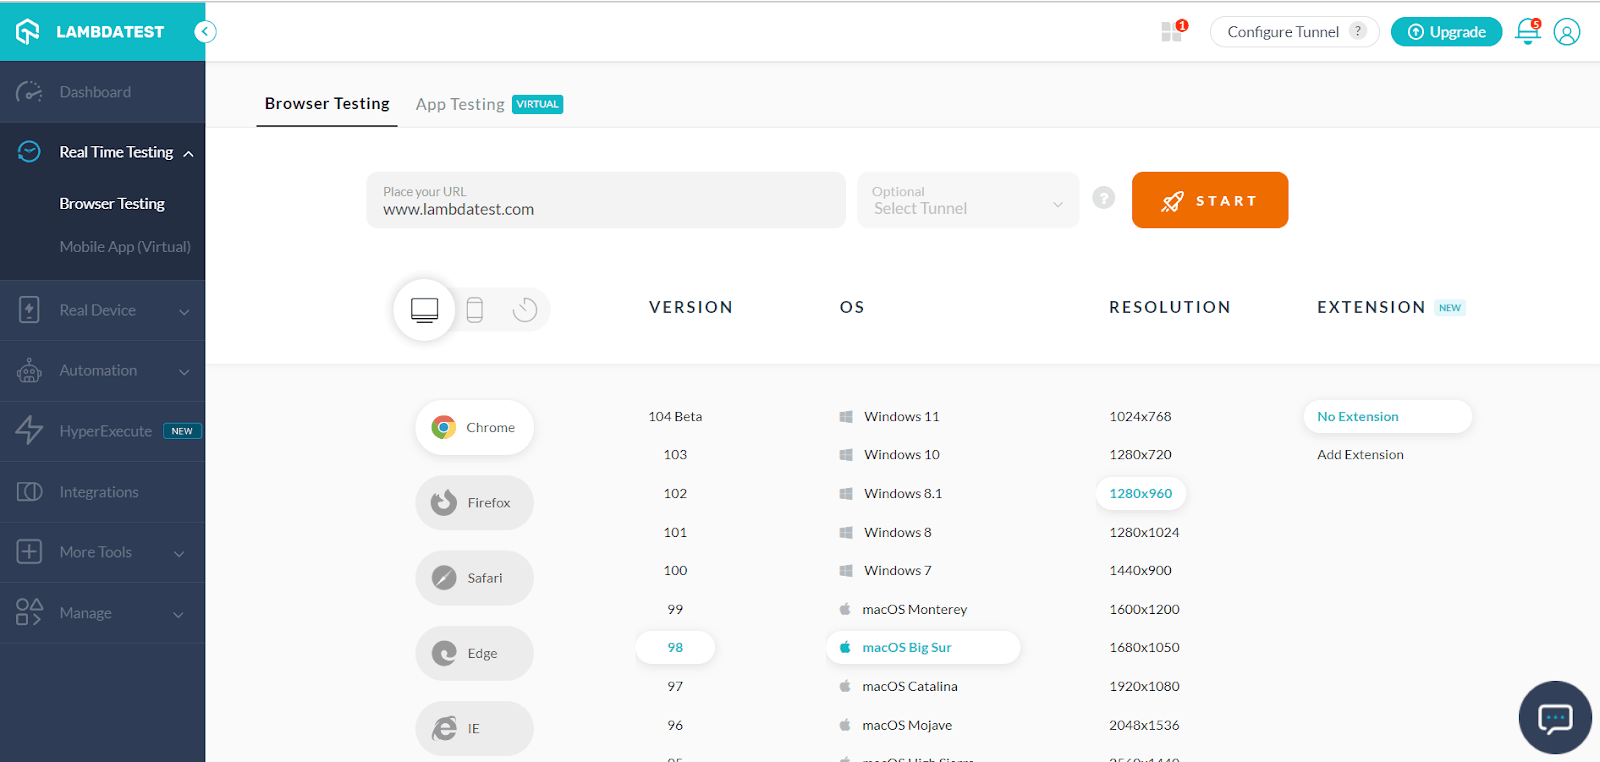
Step 2: Provide the URL of your choice. Click START.

Step 3: Go to the LT Debug page on the Chrome web store. Copy the URL.
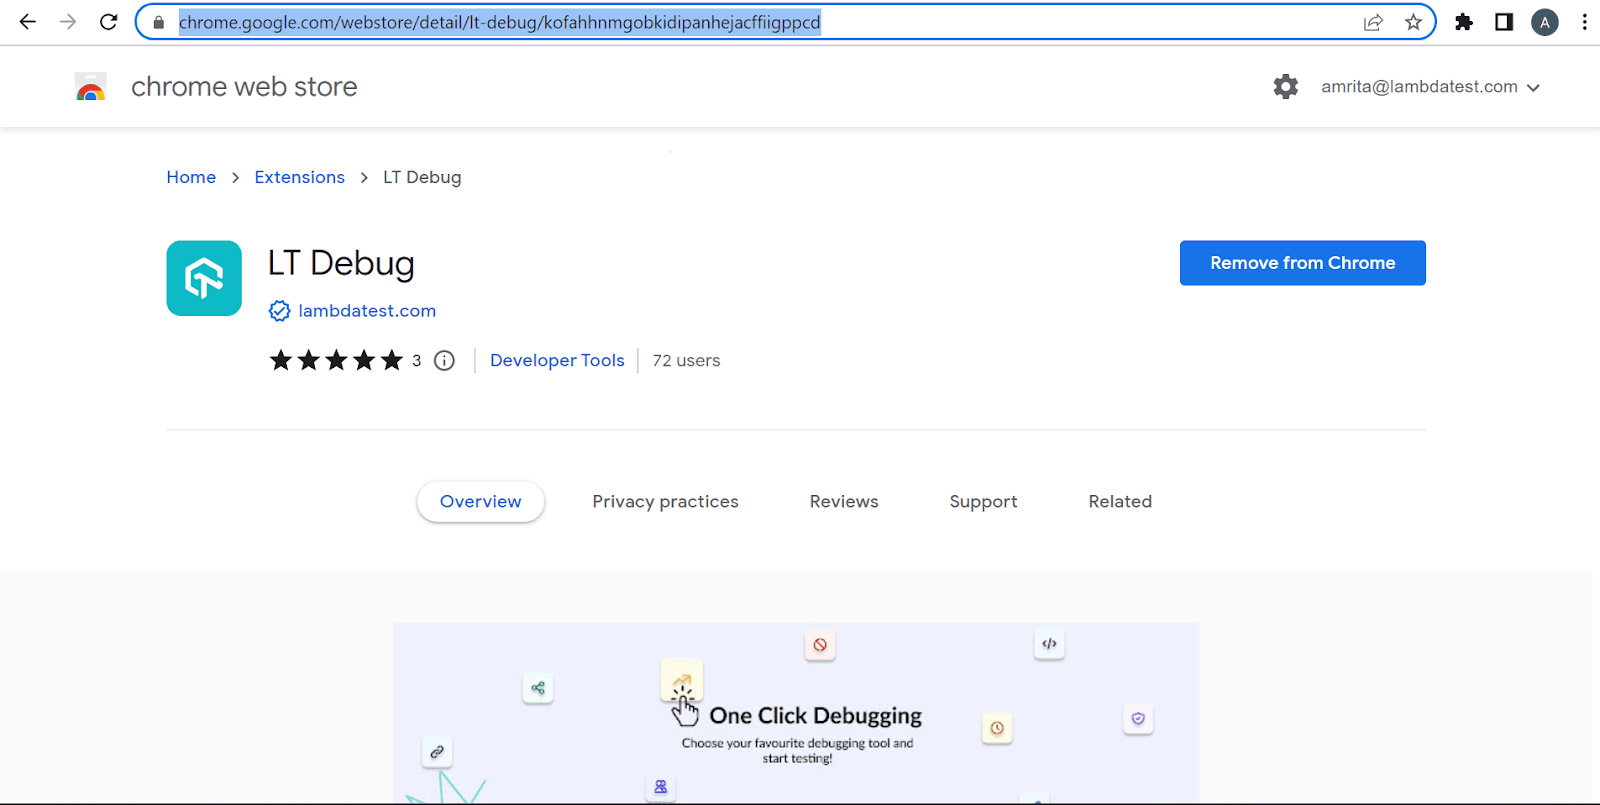
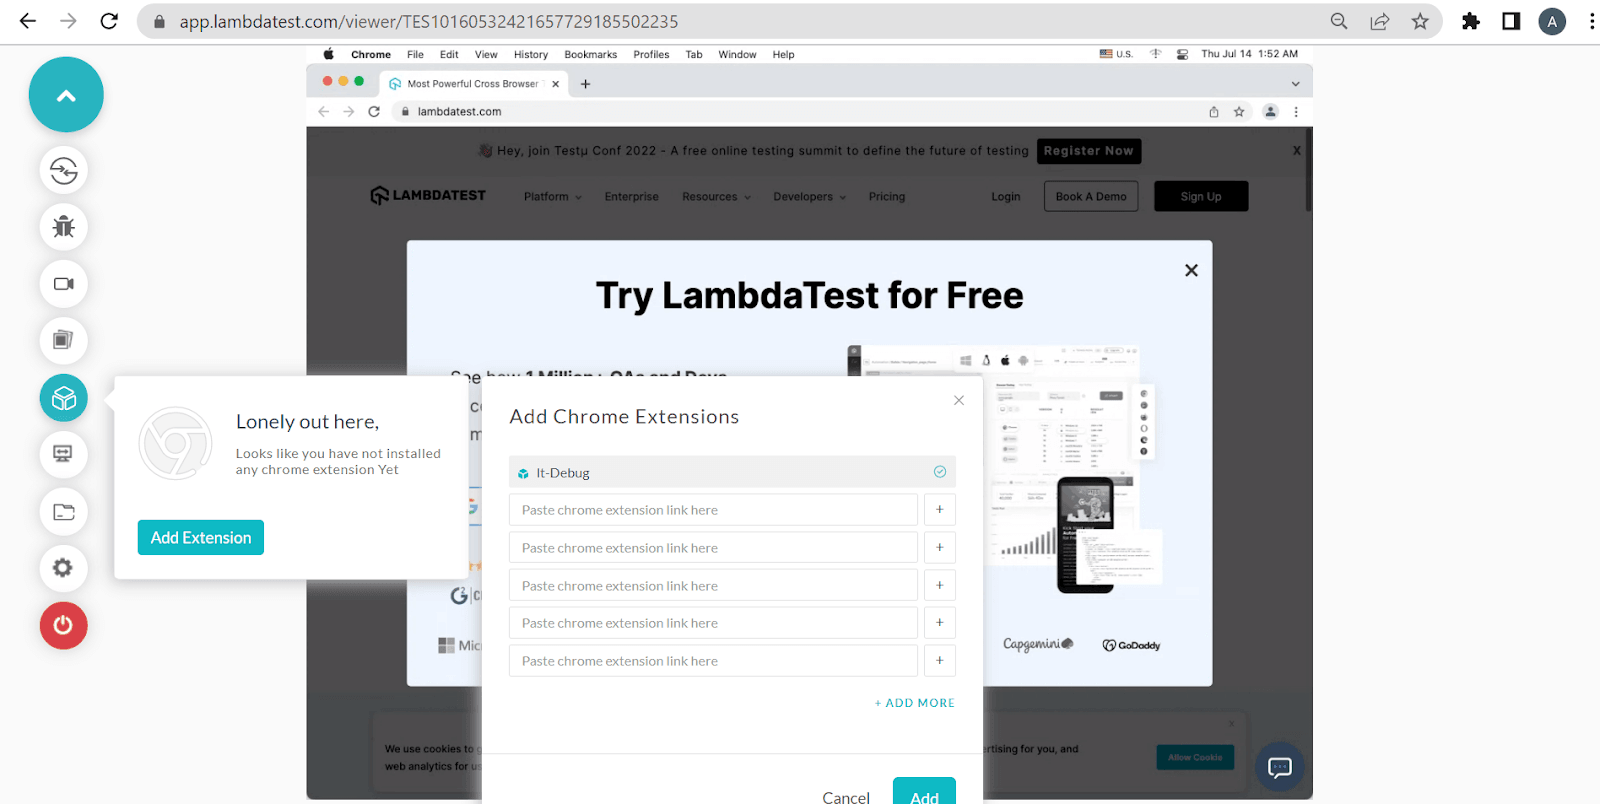
Step 4: Now, click the Chrome Extension icon and add the URL link. All set! Now you can use our real time live testing platform to add and use the LT Debug Chrome extension from any browser of your own, be it Safari or Opera.
Conclusion
Debugging would no longer be an arduous task for web developers and testers. It’s going to be simpler, fun-filled, and flexible when you use LT Debug to fast-track your work. You can also depend on our 100+ extensions if you want to make your testing life seamless. Depend on our online browser farm to perform Selenium automation tests and cross browsing tests in over 3000+ browsers, OS, and devices.
Visit our learning hub for more insights on testing with our automation testing tutorial and mobile app testing.
Happy testing!
Got Questions? Drop them on LambdaTest Community. Visit now


