How To Fast Track Cross Browser Testing & Debugging With LambdaTest?
Akshay Pai
Posted On: November 13, 2018
![]() 28410 Views
28410 Views
![]() 12 Min Read
12 Min Read
Software development is advancing by the minute. With a plethora of technological advances, developing software has become simplified. Every SDLC(Software Development Life Cycle) is aided with the help of debugging and testing. Both are highly important to ensure product quality and consistent behaviour for a stable release.
Professionals in the industry are used to the cycle of continuous development where testing and debugging go hand-in-hand. IT Professionals are well aware of their mechanism and their benefits. However, to students, the difference between testing and debugging is something of a mystery. The mysterious part lies in defining the scope of testing and debugging. Who performs each of this task, how is it quantified, and how is it performed?
On an abstract level, we can define testing as a process conducted by testers and sometimes even the developers to validate the various modules that have been developed. On the other hand, debugging is performed by the developers with adequate knowledge regarding the project to identify the cause of issues that have been identified in the testing phase.
With this understanding, let’s get into the details on what testing and debugging is and how LambdaTest can effectively help developers and testers in their respective journey.
What Is Testing?
Once the software has been developed, it goes through the process of testing to verify whether it is working as per the intended functionality. Testing, as mentioned, is carried out by a tester or even by a client with no technical awareness about the product design or workflow. Testing is broadly classified in two ways i.e manual testing and automation testing. Remember though, you can not automate the testing process up to 100%. However, the automation testing has been evident in saving the bandwidth for a software tester, so they could come up with better test scenarios. After testing, bug report comes into play as a responsibility for a software tester. Any bugs or errors are logged in a file which is further passed on to the development team to help them in debugging. These errors are then looked into and fixed for the tester to retest the application. Each type of applications will have a different testing strategy. For example, Progressive web app testing requires testing mechanisms that can verify the integrity of design and functionality with the concepts of a PWA.
This bug or error goes through a certain cycle, also known as the bug life cycle. This is the lifetime of the bug that exists and goes through several stages before being closed by the tester.
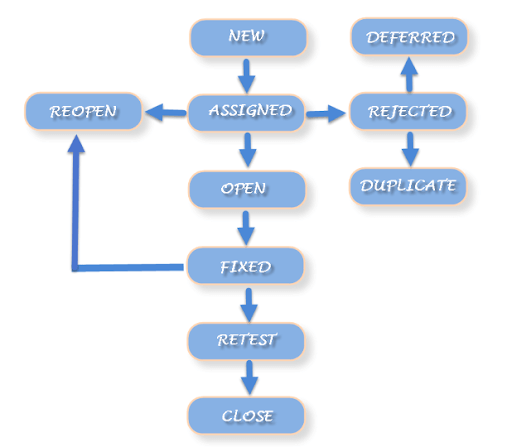
These stages include:
- New is when a new bug is registered by the tester and then forwarded to the team lead.
- Once Assigned, the bug is forwarded by the lead tester to the developer team. Further, it is given to either the developer directly in charge of the bug or it is passed on to the dev lead who approves and assigns it to the developer.
- Open is the state of a bug while it is being worked on by a developer.
- Once the necessary changes in the code have been made, the developer will forward it to the lead developer. This fix will be available for testing in the upcoming build.
- Retesting is the phase where all the changes after being introduced into the environment through the latest build are given back to the testers for testing.
- Once the retest process completes, it can go one of the two ways. If the bug has been fixed, the case is closed but if the tester feels there is still lack of performance due to the bug it will Reopen the bug and the entire process will repeat.
- Apart from this, there are times when the term Deferred is used to where the fix is delayed to a future update owing to low priority level. This is done by developers when the bug is not critical.
- In certain cases, when the developer feels that a bug that has been raised is not genuine or is not a bug, he can reject the same by updating the status as rejected. In addition, a duplicate is used to mark duplicated bug errors.
What Is Debugging?
You developed the software, you ran it through the testing software and you found some bugs. What next? Well, once the testing phase is over, the process of debugging starts. Debugging is the process of fixing the errors which have been found during the test phase. Unlike testing, the process is manual and needs an intervention of development teams. The bugs can be located with the help os special software known as a debugger.
Debugging is carried out on the basis of the report received by the testers. And the final result must look like the expected output. Once the error has been fixed, the code is resent to the tester for retesting post which it is declared fit for release.
But even during the debugging process, there are certain tips which can create an efficient environment and give more effective results.
1. Prioritization
As a developer, it is very important to know the functionalities of a software. More important is to understand their importance. Whenever a bug is raised, one should know its effect on the software. If it is not critical and will not affect the system, the developer can put it in the deferred status until the next build. This helps prioritize which bugs need to be fixed first.
2. Error Code Familiarisation
HTTP errors are generated when you try to visit a certain address but cannot access it. It usually returns HTTP error codes which signify the error type. Familiarity with these codes will help you diagnose the bugs more efficiently cutting down on time.
While it isn’t possible to remember all the codes, knowing some common occurrences will take you a long way. But, in case of any error, make sure to look up the error code to get a better insight into the type of problem and its solution.
Some common codes that debuggers come across are:
- Error 401- Incorrect credentials
- Error 404- Incorrect URL
- Error 429- Too many requests
- Error 502- Bad Gateway
- Error 504- Gateway Timeout
3. Bug Reproduction
As a debugger, you should always make sure to reproduce a copy of the bug before making any changes. This is especially very important to avoid duplication. In a scenario where you are working on the original bug and someone opens up the same ticket, all the progress you have made will be lost. So, to prevent such situations reproduction of the code is advised which can be modified and then put into the actual application.

What Is Cross Browser Testing?
With an ample variety of web browsers available in the market, end users have the convenience to visit your web application from multiple web browsers.
Flex, JavaScript, Applets, AJAX requests, Flash and many more client-side components may behave differently on different web browsers with respect to their rendering engines. The process of testing whether a website works consistently without any dependencies, or compromising quality in terms of feature delivery is what we term as Cross Browser Testing.
In today’s competitive world where the bounce back rate of users is so elevated, you need an extra edge to your website for attracting more publicity and traffic towards it. Cross Browser testing plays a vital role in coping up with competition in the global market, especially when digital discovery is being more mobile-centric.
Cross Browser Testing And Debugging With LambdaTest
Cross Browser Testing and debugging can be made simpler with the help of tools. And this exactly where LambdaTest comes into play.
What Is LambdaTest?
LambdaTest is a web-based, scalable testing platform that assists business teams by bringing their software assessment needs to the cloud infrastructure. It helps with cross browser compatibility testing of your website or web application across 3000+ browsers and their assorted versions on various OS and in diverse screen resolutions.
LambdaTest provides a variety of features to ease the effort required for cross browser testing. With the help of these, you can get an optimized testing and debugging experience.
Testing With LambdaTest
Development of an application is a long process and it is only after it has been developed that one can run and check its cross browser compatibility. With multiple devices and browsers present, it is important to ensure a thorough cross browser compatibility check with all of them.
It is with LambdaTest you can now ensure cross-browser compatibility on multiple devices including Android and iOS. It supports all versions and tests for responsiveness as well. Let us have a brief look at some of the main features that LambdaTest testing tool has to offer.
1. Online Cross Browser Compatibility Testing
LambdaTest offers a live browser testing environment enabling cross-browser testing. Along with the ability to conduct live testing, it enables screen recording and screenshot functionality. This is valid for any browser version on any operating system and device that you select which also comes with an RIA software and tools for developers.
2. Multiple Desktop And Mobile Support
The list of browsers on both Windows and Mac operating systems is endless. Some popular browsers include Google Chrome, Firefox, Opera, Edge, and Safari. These offer cross-browser compatibility testing and mobile testing as per your requirements. In addition, almost every mobile device is supported by real-time testing. Ensuring that your application is compatible with all major mobile devices and operating systems has never been easier!
3. Page Report Screenshots
With LambdaTest, the user is provided with a screenshot of the entire testing process within seconds. When conducting a cross-browser compatibility test, the user can simply select from a list of presets. Moreover, even when testing your locally run websites using LambdaTest Tunnel, you get full page screenshots.
4. Visual Testing
With the LambdaTest compatibility testing, it is now easier to analyze the visual appeal of your application. This includes responsiveness for different screen sizes without compromising on the quality of the appearance. In addition, LambdaTest also allows you to conduct an automated visual regression testing for ensuring that your layouts are perfect and identify any bugs which might affect the performance. This includes any issues such as padding, icon size, element position and color which might miss a common eye. Testing across multiple screen resolutions is a must and that is exactly what LambdaTest has to offer.
5. The Inbuilt Issue Tracker
With LambdaTest cross-browser compatibility test, it is easy to manage the bugs detected. These can be managed directly from the LambdaTest console. It gives a holistic view and control such as assignment, tracking, sharing of bugs and sporting the report to PDFs to the users. Moreover, the inbuilt issue tracker is easy and flexible to use.
Debugging With LambdaTest And Developer Tools
LambdaTest is not only limited to help you with testing but also assists you in debugging your web applications for both mobile and desktop devices. While testing cross-browser compatibility, you also get access to debugging tools for any browser and browser version that is required.
Moreover, the developer tools also support debugging for mobile devices on both Android and iOS also giving you access to real-time support for web pages and web apps. Imagine opening your project on a mobile device and not being able to debug it.
Well, LambdaTest has the solution to the problem. You simply open up the emulator for the device and run through to check for any bugs. Post which debugging can be accomplished using the LambdaTest debugging tools.
Brief Guide on Using the Developer Tools
- To debug, we need to access the LambdaTest emulators with developers tools. First, open the real-time console through the real-time option in the menu.
- Once opened select mobile devices on the real-time console. This is important to access mobile device debugger.
- Selecting the type of emulator is crucial. Select Android or iOS emulator whatever is required and enter the URL before clicking the Launch button.
- This opens up a mobile device emulator with the selected configuration settings.
-
Now, on the left-hand side of the menu, you will observe an option to developer tools. Open these tools and start the debugging process.
Once you are in the developer mode you will see a section on the lower end of your screen. This is the developer tools window which shows the code for your application.
When you click on the ‘DevTools’ button a new window pops up or appears at the bottom. This is the source code for the application on that particular device. The developers now have the access to all the technicalities and can use the visual appearance on the emulator to find out any bugs and change the code accordingly.
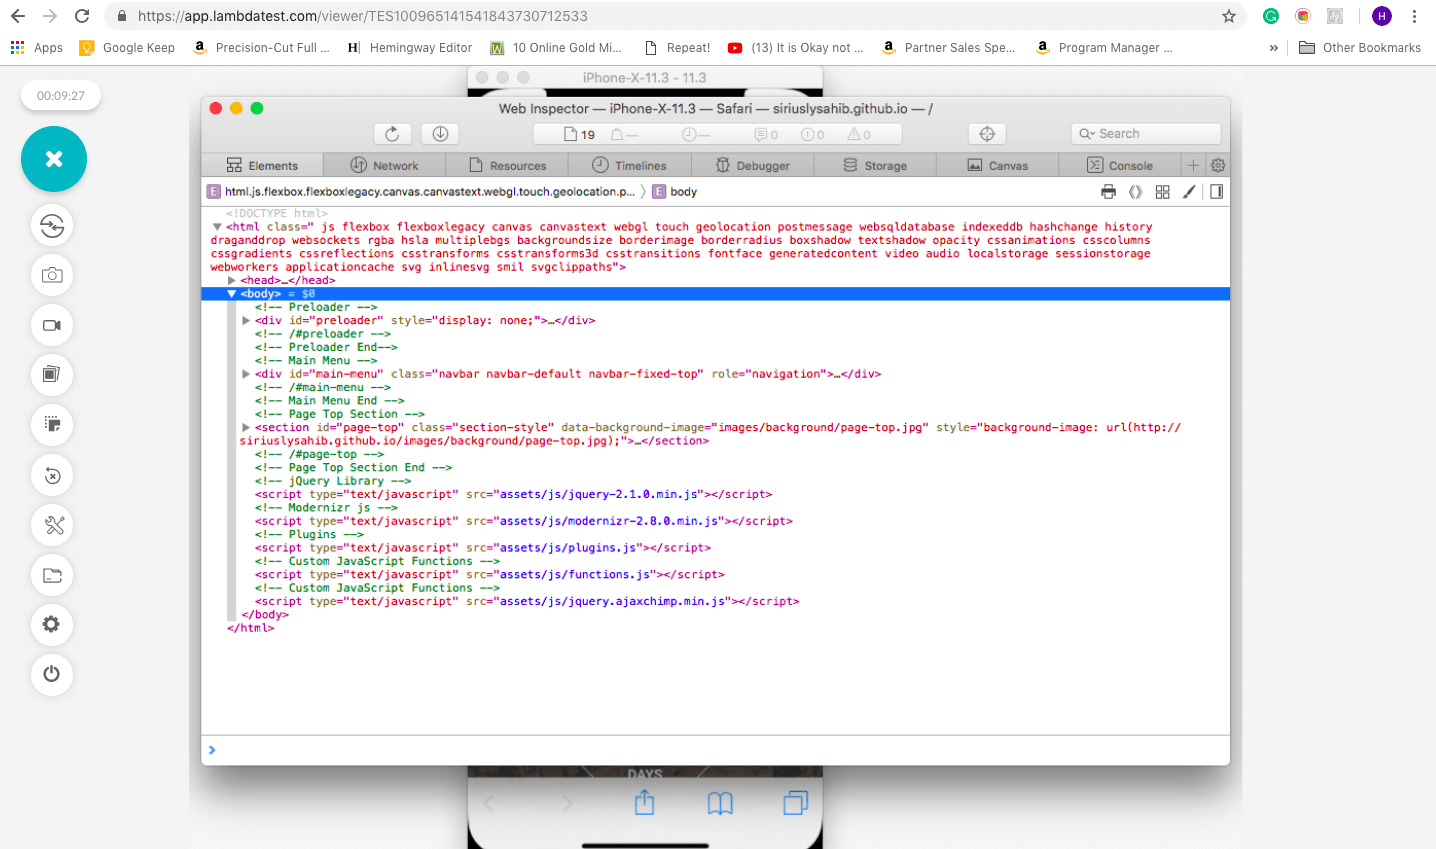
In addition, the developer can get a feel of the application on the emulator and if there are any glitches they can be fixed in the source code.
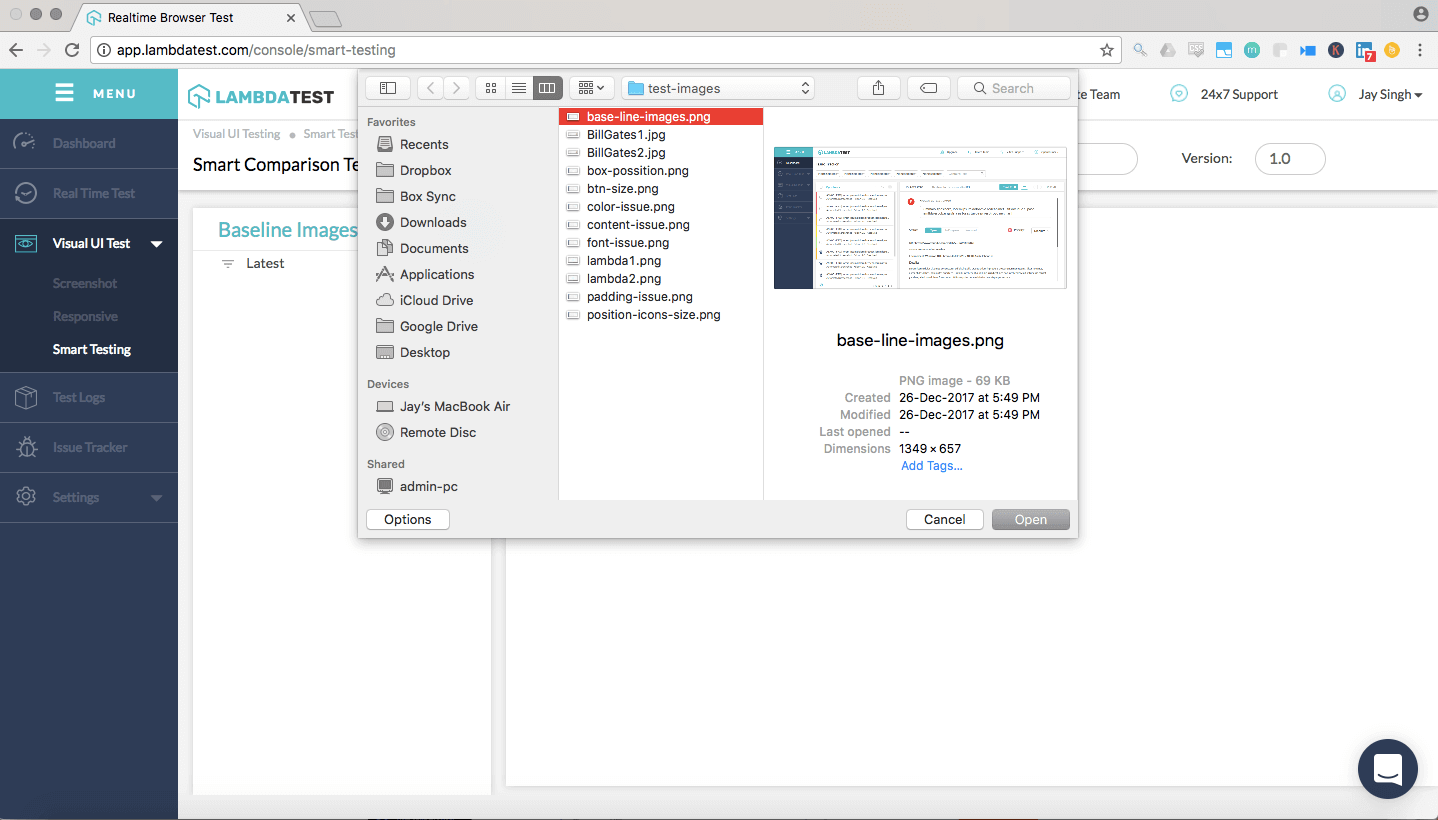
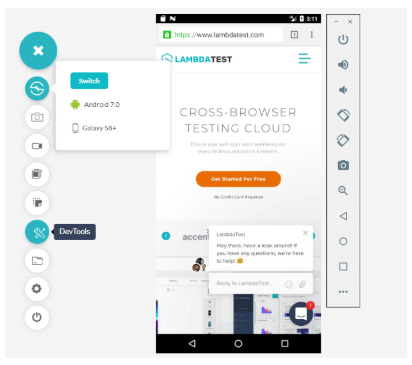
Try LT Debug Chrome Extension for debugging websites!
Conclusion
Testing and debugging are two imperative phases of any SDLC. They help to build the confidence in your website or web app, before you deploy it into the market or make any change on an already existing one. and ensure consistency to your users. Every application undergoes testing and debugging and it’s an on-going process until the time the application is alive.
LambdaTest offers an all-in-one solution to your debugging and testing requirements giving you the ease and flexibility of perfecting your web app.
Related posts:
1. Manual Testing v/s Automation Testing
2. 27 Tips for finding bugs in your website
3. Challenges Faced During Website Automated Testing
Got Questions? Drop them on LambdaTest Community. Visit now


