Houston, We Have Problems With The Queries [Testμ 2023]
LambdaTest
Posted On: August 24, 2023
![]() 6102 Views
6102 Views
![]() 9 Min Read
9 Min Read
Many developers create queries on the applications without confirming if the performance is correct or not. Even by performing a lot of testing, there is always a chance of facing issues in production, particularly when dealing with a high volume of requests that affect the database or the application itself.
Andres Sacco addressed how the performance problems on the queries could affect an API in different aspects. Some queries connected to join operations can cause a harmful effect. However, most of the queries can be written wrong by the developer without any framework’s assistance.
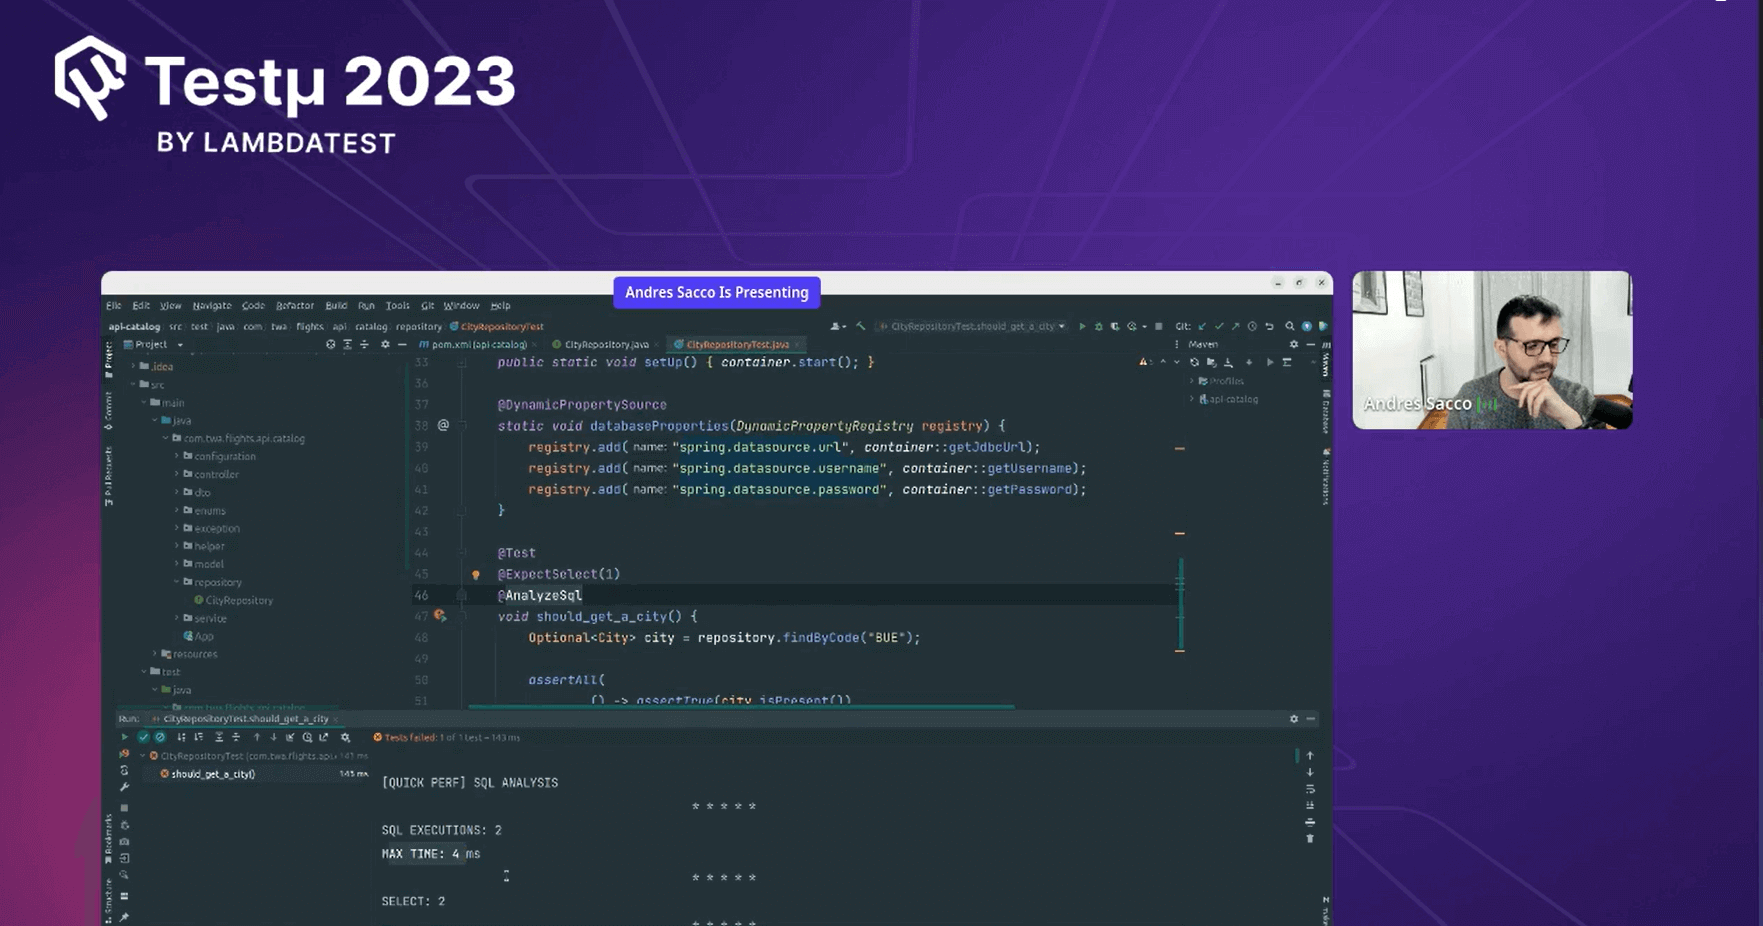
In this session, Andres Sacco covered a short scenario with a microservice that executes different queries to insert/update or obtain information from other tables with performance issues. This scenario will help you learn how to create some tests on the layer that access the database and include some library like QuickPerf to analyze and detect problems in the performance.
About the Speaker
Andres Sacco has been a developer since 2007 and has used different languages like Java, PHP, NodeJs, Scala, and Kotlin. Most of his experience and background were in Java, libraries, and associated frameworks. Andres Sacco continuously worked on improving the performance, stability, and quality of the applications of each company. Later, in 2017, he started finding new ways to optimize the transference of data between applications to reduce the cost of infrastructure.
If you couldn’t catch all the sessions live, don’t worry! You can access the recordings at your convenience by visiting the LambdaTest YouTube Channel.
He suggested some actions applicable in all the manual microservices and others in just a few. All this experience and learning is captured here at Manning.com, which is a creation of a series of theoretical-practical projects.

Recently, he published a book on Apress covering the latest version of Scala. He has also covered a set of theoretical-practical projects consisting of uncommon ways of testing like architecture tests and chaos engineering.
Besides being a developer, he is also a Technical Reviewer on the books of the editorials Manning, Apress, and Packt. He also dictated internal courses to audiences like developers, business analysts, and commercial people.
Context: Have a microservice which have performance issues
Andres started highlighting the context of microservices that have performance issues, and later, he elaborated on four major contexts that cause performance issues.
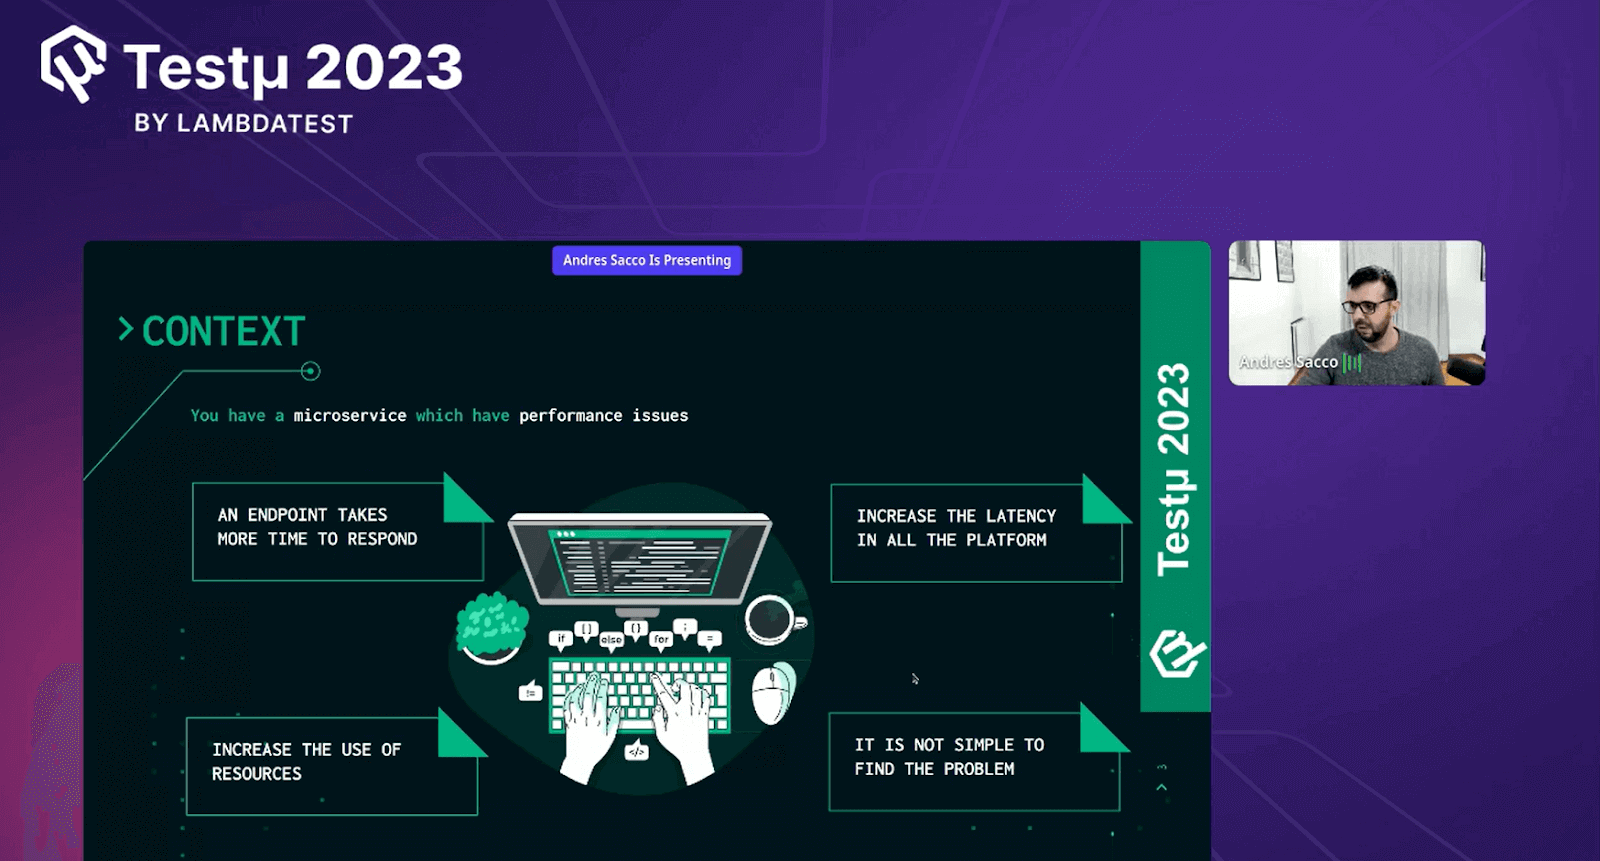
- Endpoint: Andres discussed issues where certain system parts responded slowly. These slowdowns could impact how well the system functioned and how quickly it responded to user requests. Resolving these delays was crucial to ensuring smooth and rapid software and service operations.
- Increased Latency: Heightened latency, which resulted in delays or lags in system response times, was another performance concern. Addressing these latency issues was essential for improving overall system performance and ensuring quick response to user interactions.
- Increased Resource Usage: Heightened resource usage, associated with performance concerns, caused delays or lags in system response times. Addressing these latency issues was essential for improving overall system performance and ensuring quick response to user interactions.
- Identifying the Problem: Andres emphasized that performance issues were often intertwined with various factors, including system configuration, software code, network conditions, and user behavior. This complexity made isolating the exact cause of performance bottlenecks challenging. As a result, a comprehensive and systematic approach involving thorough monitoring, profiling, and analysis was necessary to accurately diagnose and address these performance challenges.
How do we find the problem?
Andres provided a step-by-step procedure that allowed his audience to identify and consider these four major points when there was a need to identify the problem.
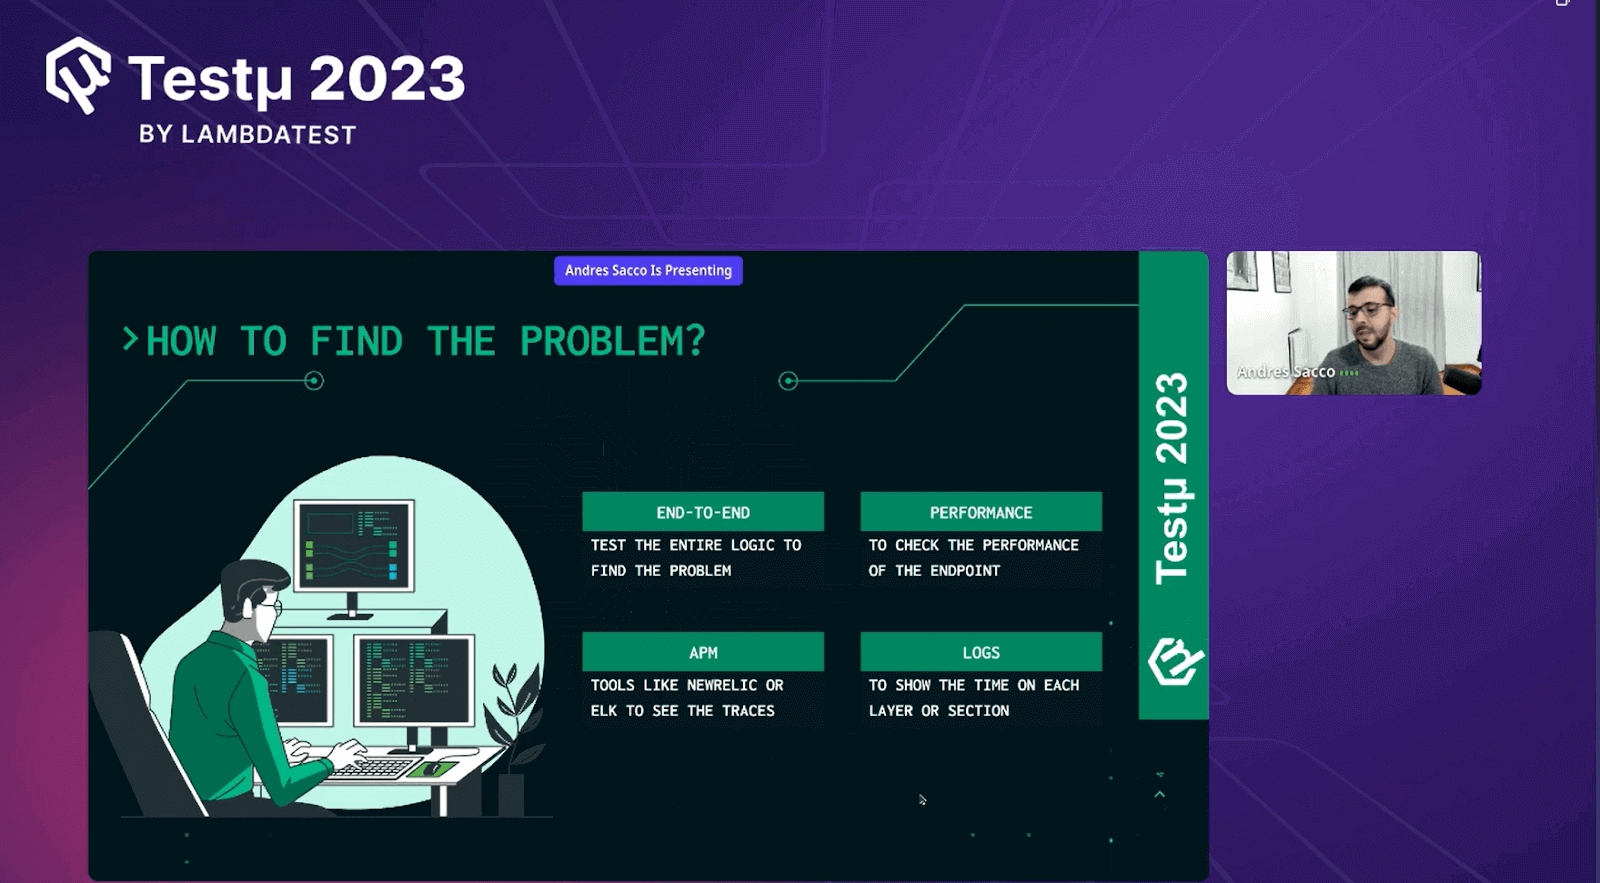
Andres explained the following points and how they helped identify the problem:
- End-to-End: Andres explained the significance of tracing a request or process’s entire journey through the system. This approach allowed for pinpointing performance bottlenecks or issues at various process stages, facilitating faster problem resolution.
- Performance: Andres stressed the importance of focusing on performance metrics and benchmarks to assess system efficiency comprehensively. Monitoring key performance indicators enabled the identification of deviations from expected norms, helping isolate problematic areas and prioritize optimization efforts.
- APM (Application Performance Monitoring): APM tools provided real-time insights into application behavior. Continuous monitoring of application performance, anomaly detection, and the ability to delve into specific components or transactions helped identify the root causes of performance problems.
- Logs: Andres highlighted the critical role of analyzing logs in troubleshooting performance issues. Logs recorded system events, errors, and other essential information. Reviewing logs allowed the identification of error patterns, abnormal behaviors, and events correlated with performance degradation, aiding in effective issue resolution.
Why could these approaches fail?
Andres discussed why these approaches sometimes failed. He pointed out that despite their effectiveness in many cases, these methods could fall short when dealing with extremely complex scenarios.
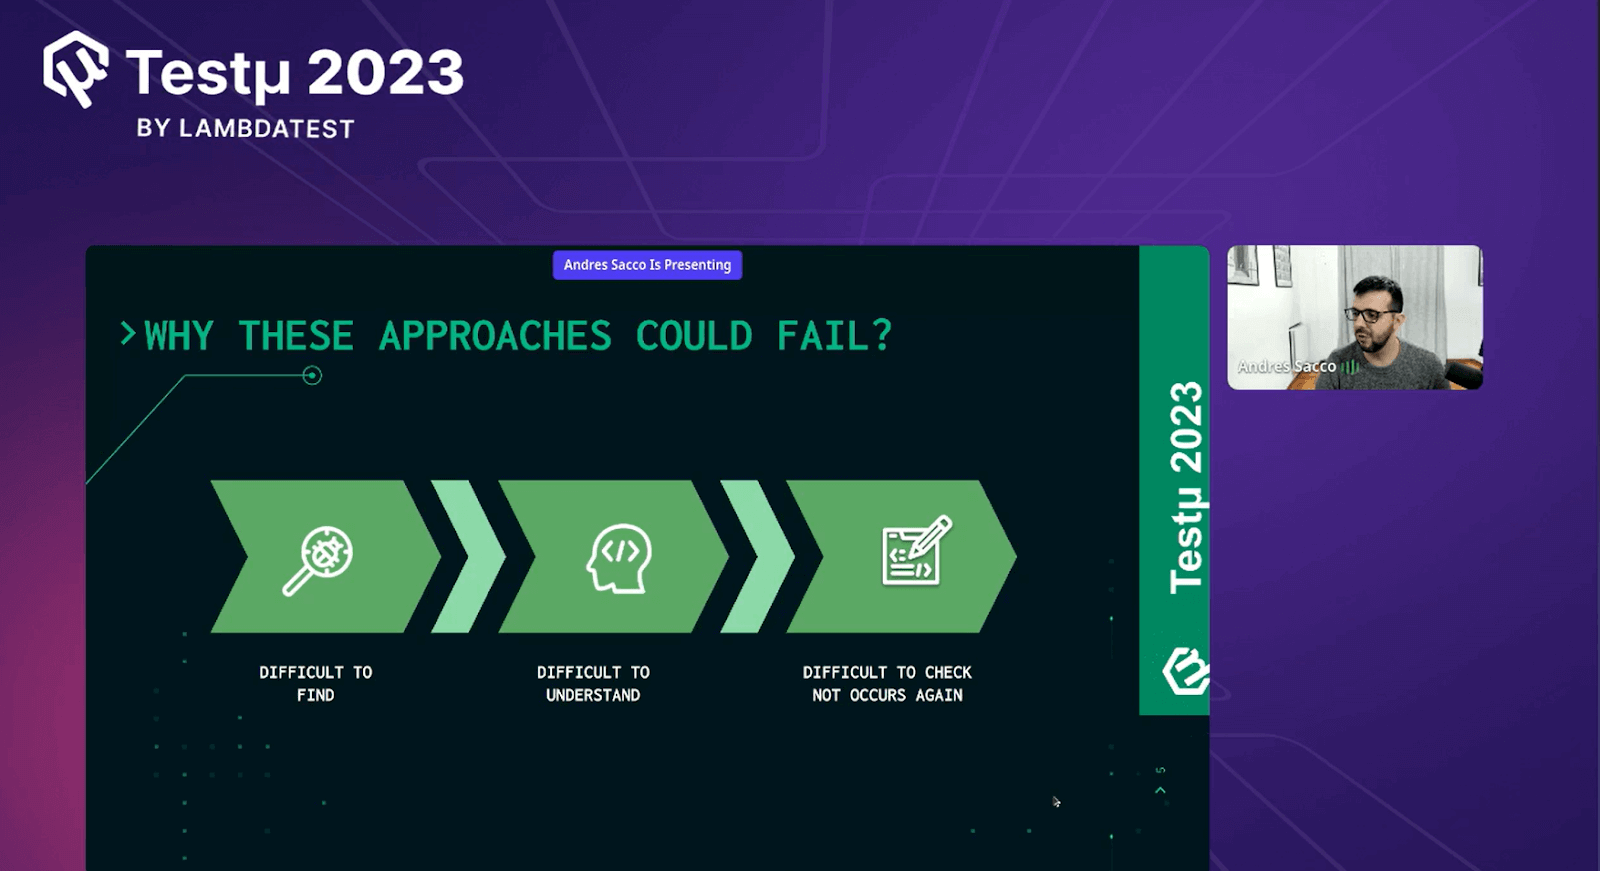
In such instances, the volume of data generated might overwhelm traditional troubleshooting techniques. Additionally, the dynamic nature of modern IT environments made it challenging to adapt monitoring and analysis strategies to rapid changes.
Andres emphasized the need for continuous improvement and exploring innovative solutions to address these limitations and enhance problem-solving capabilities.
Which tools exist to check and test?
Andres created a table to help the audience understand which tool works best and which tools can deliver the best outcomes.
The table outlined the strengths and weaknesses of each tool in various scenarios, aiding in making an informed choice based on specific performance testing needs. This approach helped users determine which tool was most suitable for their particular use case, ensuring effective problem detection and resolution.
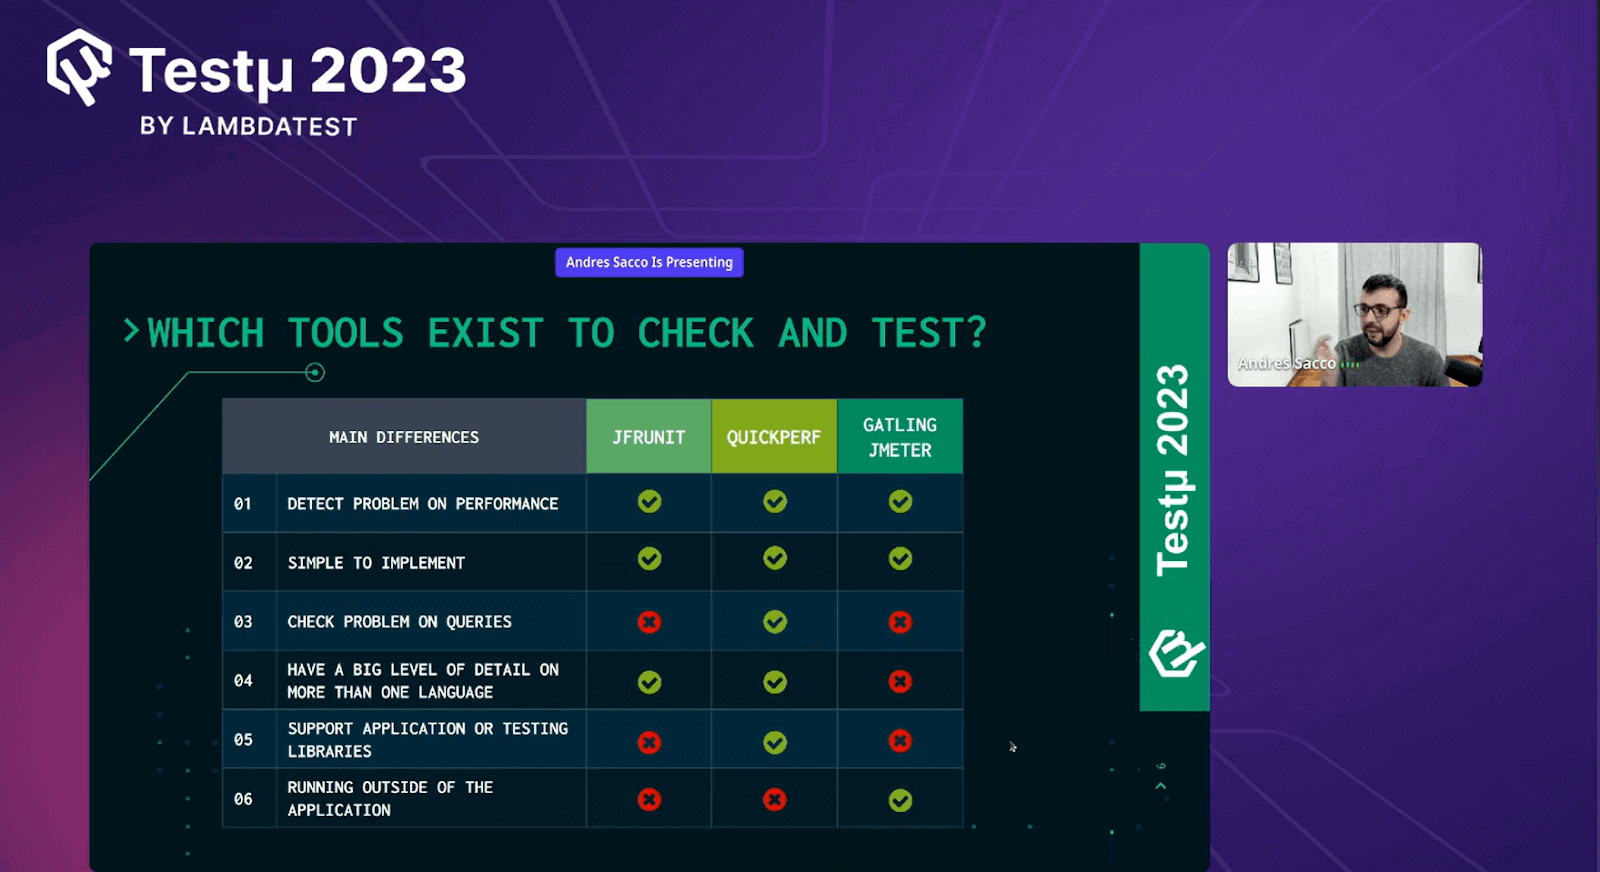
| Main Difference | JFR UNIT | QUICKPERF | GATLING JMETER |
| Detect problems on performance | ✅ | ✅ | ✅ |
| Simple to Implement | ✅ | ✅ | ✅ |
| Check problems on queries | ❌ | ✅ | ❌ |
| Have a high level of detail on more than one language | ✅ | ✅ | ❌ |
| Support or testing libraries | ❌ | ✅ | ❌ |
| Running outside of the application | ❌ | ❌ | ✅ |
Pros & Cons Using QuickPerf
Andres provided a detailed analysis of the advantages and disadvantages of using QuickPerf, aiming to offer the audience valuable insights into whether they should have considered using QuickPerf or not.
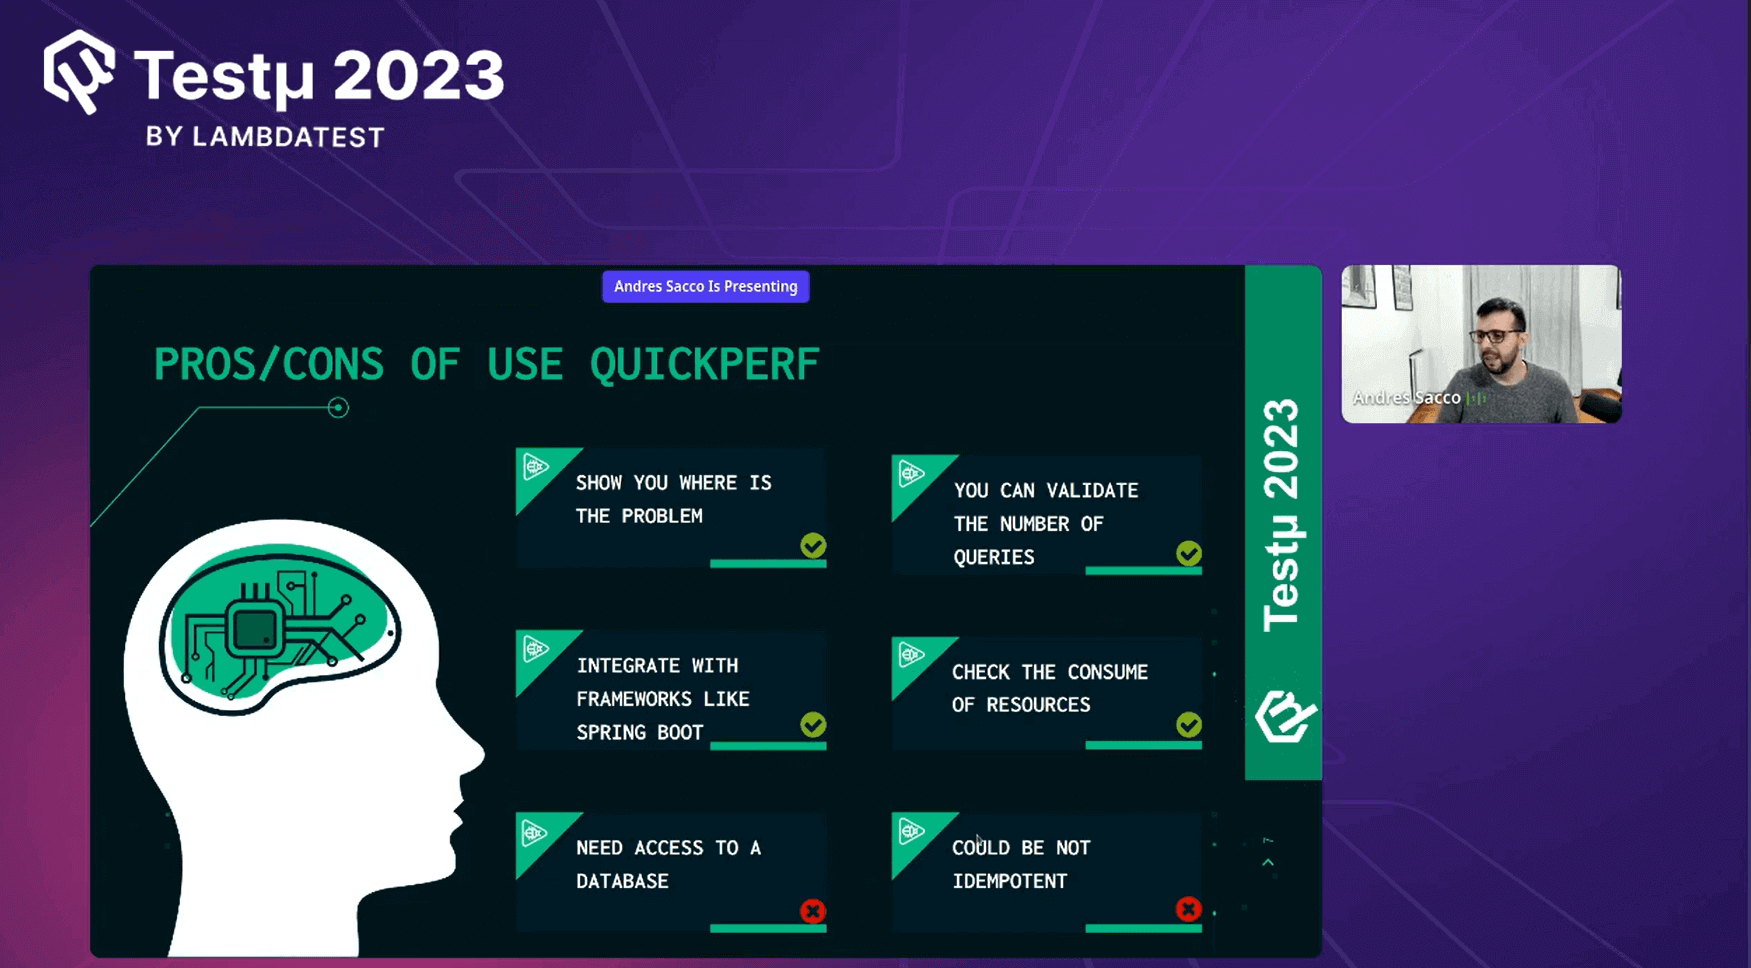
Pros of QuickPerf
- Shows where the problem exists.
- Easy to validate any number of queries.
- Integrating with a framework like Spring Boot is easy.
- Check the usage of resources.
Cons of QuickPerf
- Need access to a database.
- It could not be repeatable.
Coding Example
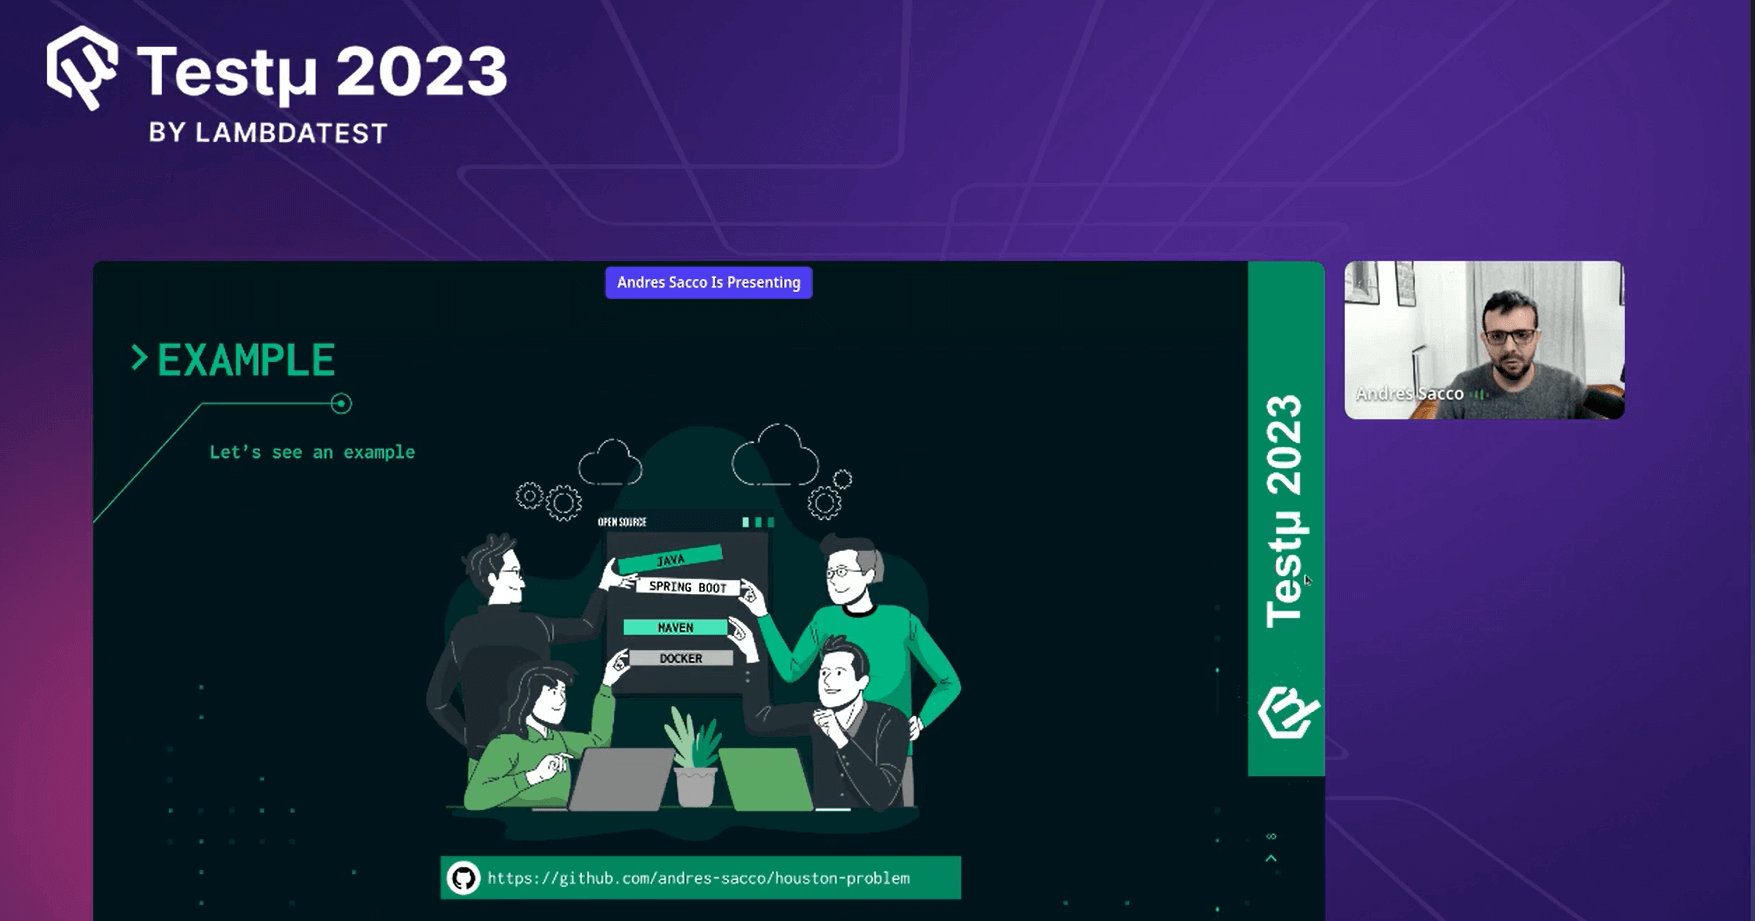
Andres provided a coding example during his presentation, aiming to help his audience better understand the problem area. He shared this Git Repository with the audience, which they can refer to in the future and learn from it.
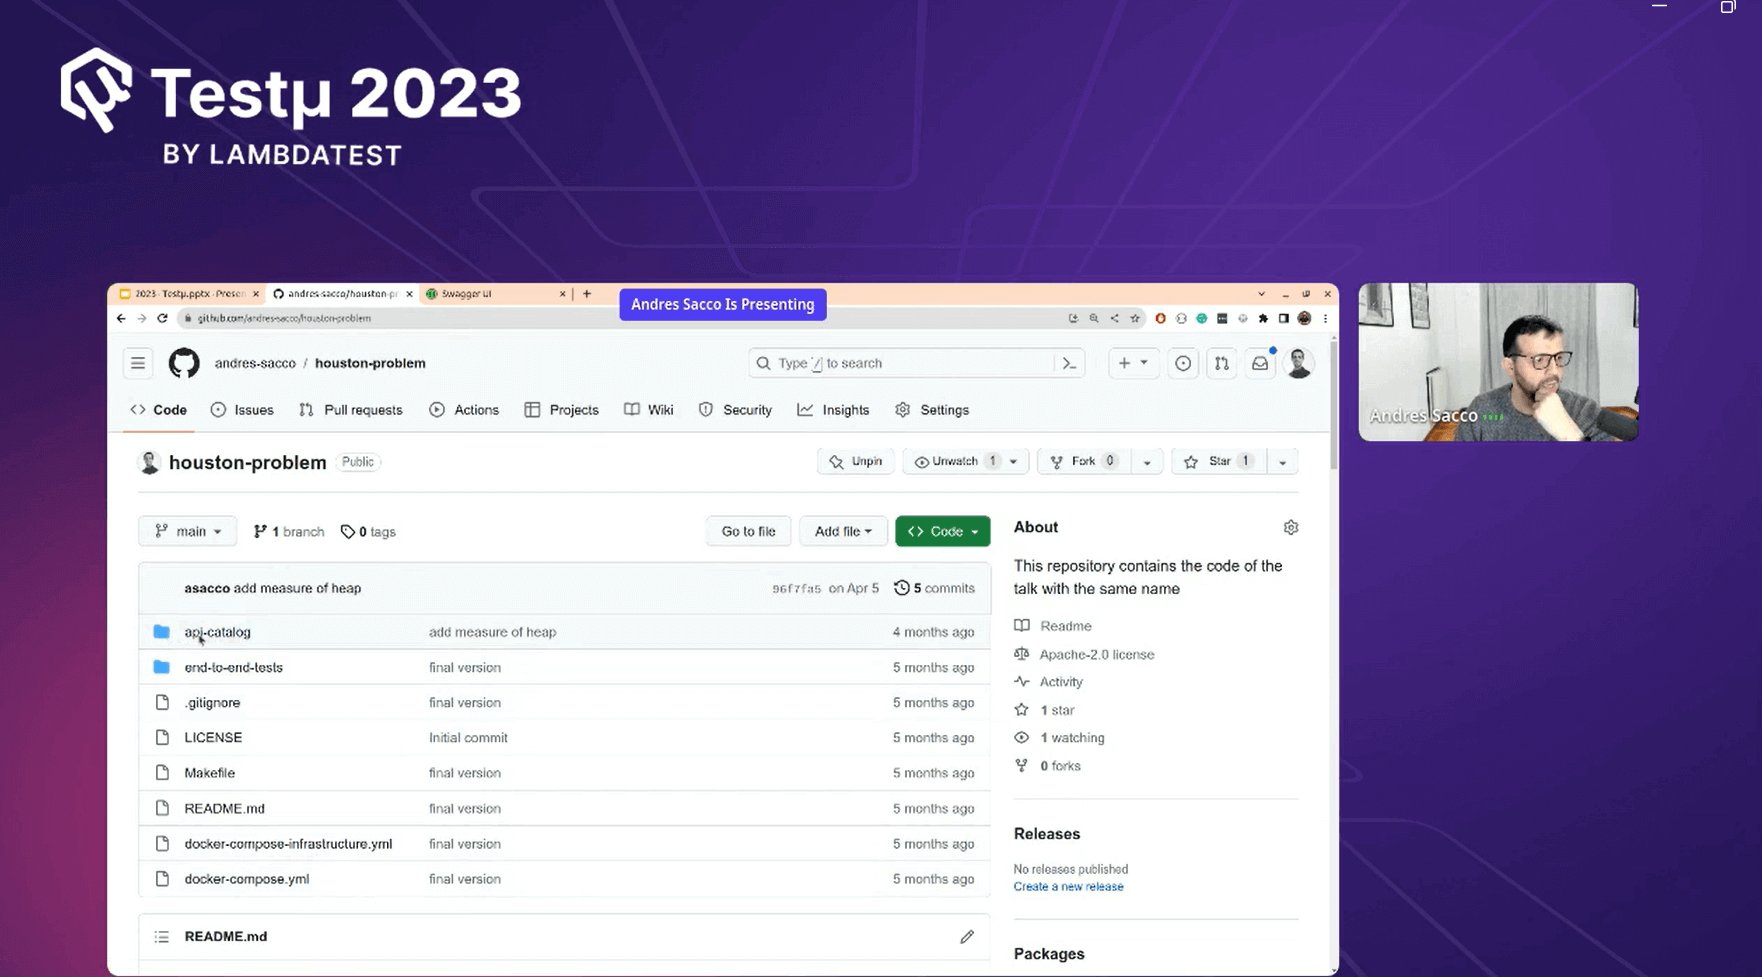
Andres explained the contents of the folder within the Git repository. He mentioned the “api-catalog” folder, which contained all the source code related to API issues, and showcased his functional API webpage displaying all his APIs. Additionally, he discussed the “end-to-end” folder, which contained the code related to performance testing.
Andres shared documentation for the APIs using Swagger, where all the APIs were explained in detail and were operational. This provided valuable insights into how APIs functioned, making it a great learning resource.
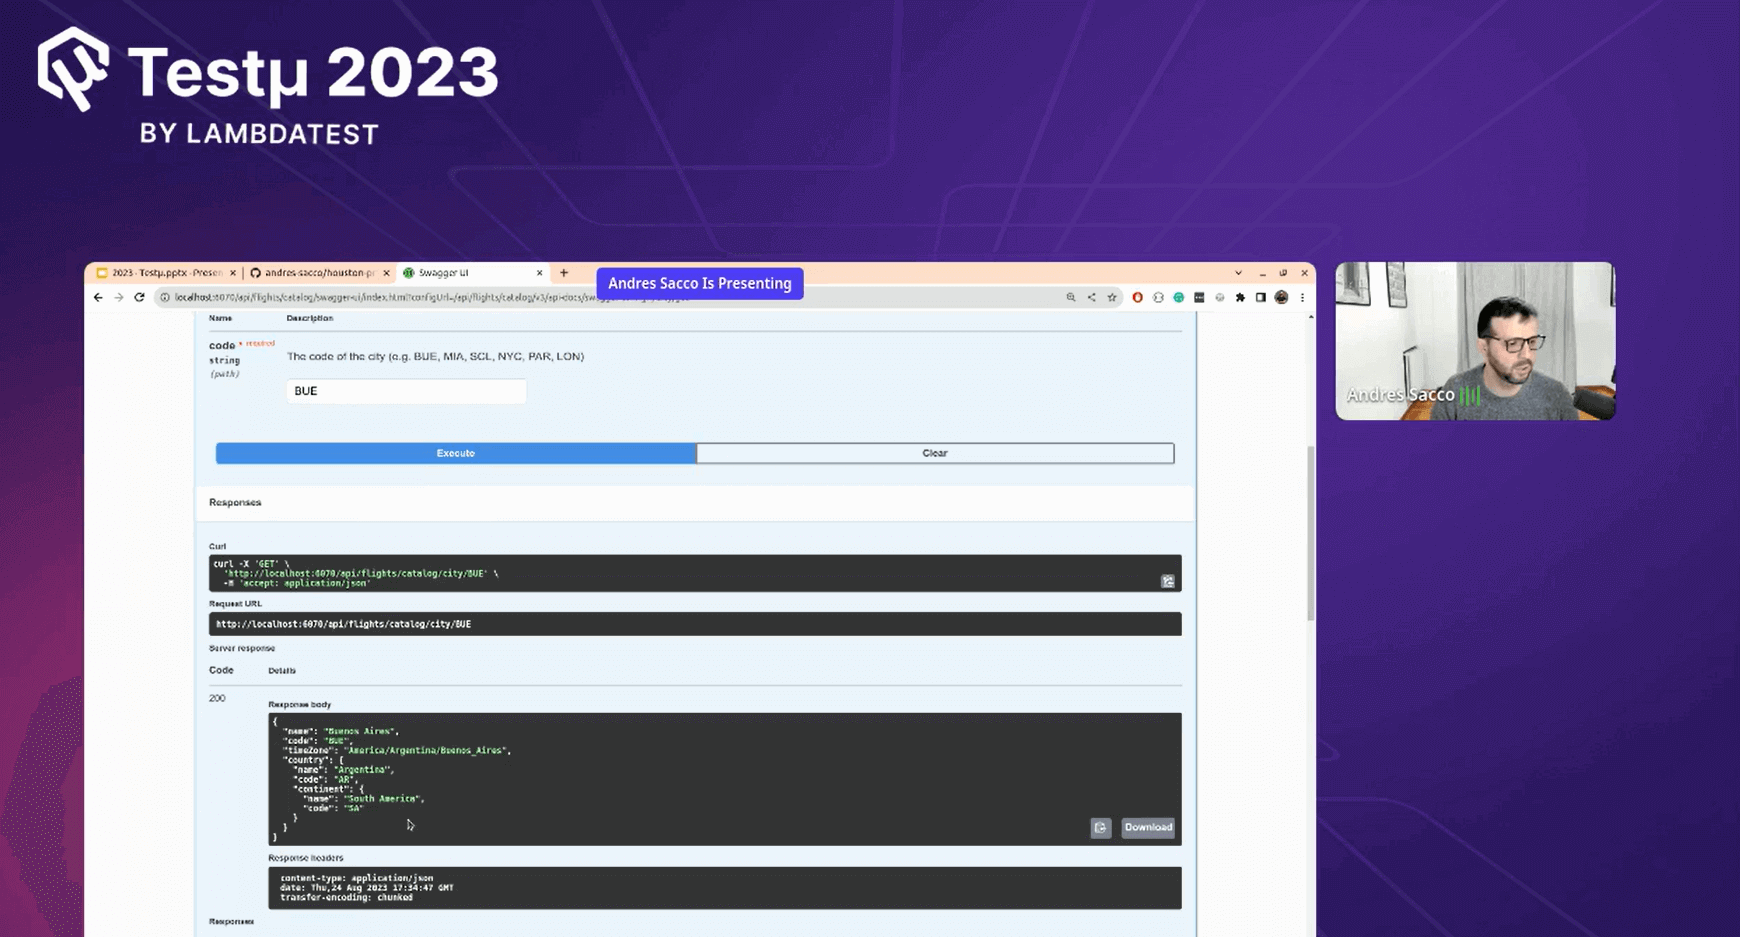
Andres proceeded to demonstrate live coding in the end-to-end folder for performance testing. He covered the complete coding process, providing a step-by-step guide on utilizing the provided API resources and implementing them effectively.
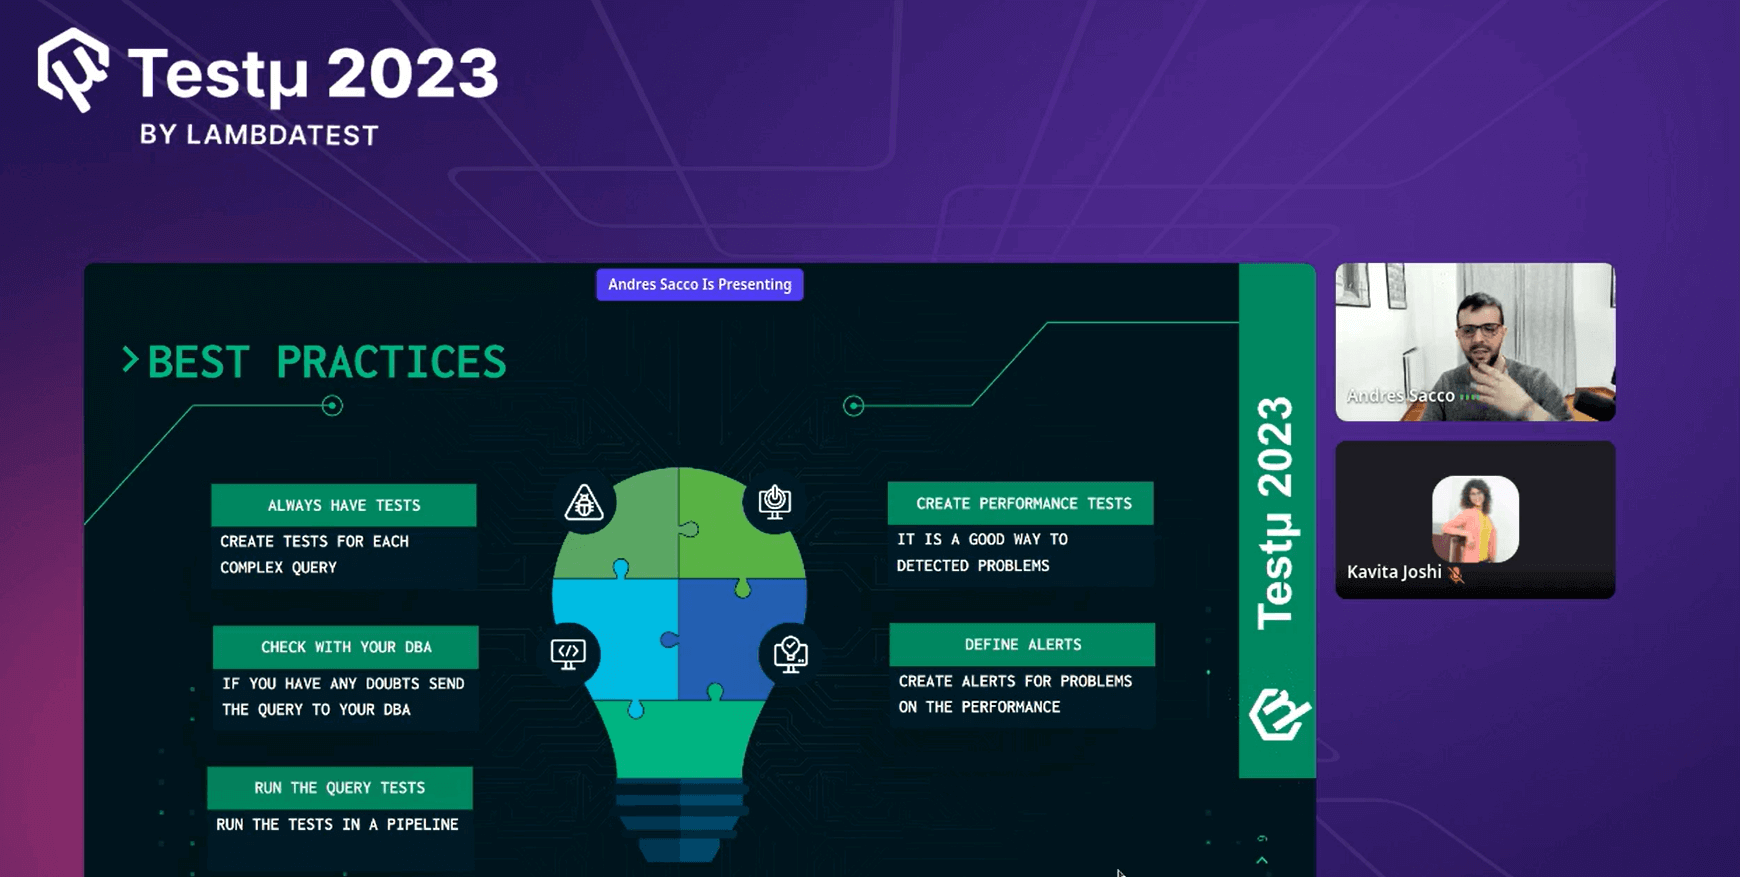
Additionally, he emphasized the best practices that could assist in achieving the desired outcome more efficiently and effectively.
Indeed, it was a great session by Andres. He further closed the session by answering his audience.
Q & A Session
- Did you encounter any unexpected or counterintuitive performance challenges related to database interactions? How did you go about diagnosing and addressing these challenges?
- In database testing, what is required for writing good test cases?
- What steps have been taken to address and resolve the issues encountered with the queries, and how do you plan to ensure the stability and efficiency of the query system moving forward?
- What will be the chaos testing scenario for database testing?
Andres: Yes, we encountered some unexpected performance issues with databases. To tackle them, we closely examined the queries, monitored database activity, and used performance testing tools to identify bottlenecks. Then, we optimized the queries and made necessary adjustments to enhance database performance.
Andres: To write good test cases for database testing, you need to consider several things. First, understand the database schema and data flow. Then, create test cases that cover various scenarios, including data insertion, retrieval, and modification. Ensure your test cases are well-documented and cover normal and edge cases to validate the database’s functionality thoroughly.
Andres: Address the query issues by identifying slow-performing queries and optimizing them. Also, monitor the query performance regularly. To ensure stability and efficiency, we plan to continue monitoring, use performance tools, and follow best practices for query optimization.
Andres: Chaos testing for databases involves intentionally causing disruptions to the database to see how it behaves under stress. We might simulate scenarios like sudden traffic spikes, server failures, or data corruption to test the database’s resilience and recovery capabilities. The goal is to uncover vulnerabilities and improve the database’s reliability.
Have you got more questions? Drop them on the LambdaTest Community.
Got Questions? Drop them on LambdaTest Community. Visit now


