LT Browser: Live With Performance Report To Test Your Website Score
Salman Khan
Posted On: November 27, 2020
![]() 22321 Views
22321 Views
![]() 5 Min Read
5 Min Read
Hey, testers! We hope you are staying safe and healthy amid these unusual times. It has been quite a productive season here at LambdaTest. If you have been following our latest updates, you already know that we’ve introduced lots of new features with the sole focus on making our products more user-friendly. Today, we are pleased to announce that we have integrated Google Lighthouse with LT Browser, making it easier and quicker for our users to view their websites’ performance statistics.
Now you will be able to capitalize on the real power of performance reports for your website. LT Browser will let you check your website’s desktop and mobile score along with a range of other performance metrics. Escalate your responsive testing experience with LT Browser now!
Let’s understand what role Google Lighthouse plays and how you can leverage it within the LT Browser. You’ll also find some bonus additions to make your mobile website testing experience more seamless.
TABLE OF CONTENT
What Is Google Lighthouse?
Developed by Google, Google Lighthouse is an automation tool designed for web developers to measure and enhance their website’s performance. It takes a web address as an input and generates a list of recommendations based on performance, search engine optimization, accessibility, PWA, etc. By using these metrics, you can boost page load performance and make your site faster than ever.
LT Browser Performance Reports Powered By Lighthouse
Measuring the efficiency of your website can be challenging. To elevate the performance of your website, you need to understand exactly what you measure. LT Browser now integrates Google Lighthouse! This allows you to measure the performance statistics of your website right away. You won’t need to download any extensions; LT Browser provides an integration solution for viewing website scores and testing your website’s responsiveness.
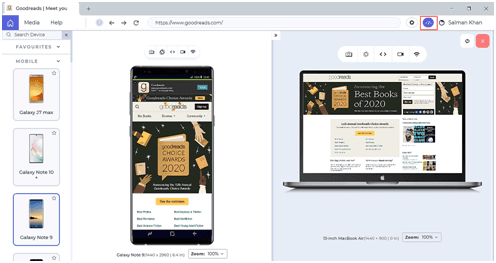
In addition to ensuring the website’s responsiveness, you can now view your website’s performance metrics across 40+ devices with just a simple click. You would have to click on the meter icon to view your website’s metrics, as shown below.
How Does This Performance Report Help You?
With the new power-packed and Lighthouse backed performance reports, you will be able to do a lot more than everyday reporting. With LT browser, you can now view the following metrics:
Desktop And Mobile Score
Based on the performance of your website over different browsers, the desktop and mobile scores will be generated. The score is divided into three categories, namely- Poor, Average, and Medium. As the names suggest, they will help define the page speed score of your website.

Performance Metrics
It comprises audits of performance, best practices, SEO, progressive web apps, and more. By analyzing these audits, you would know how well your page performs and make enhancements to those web pages. You can view the performance metrics for both desktop and mobile devices.
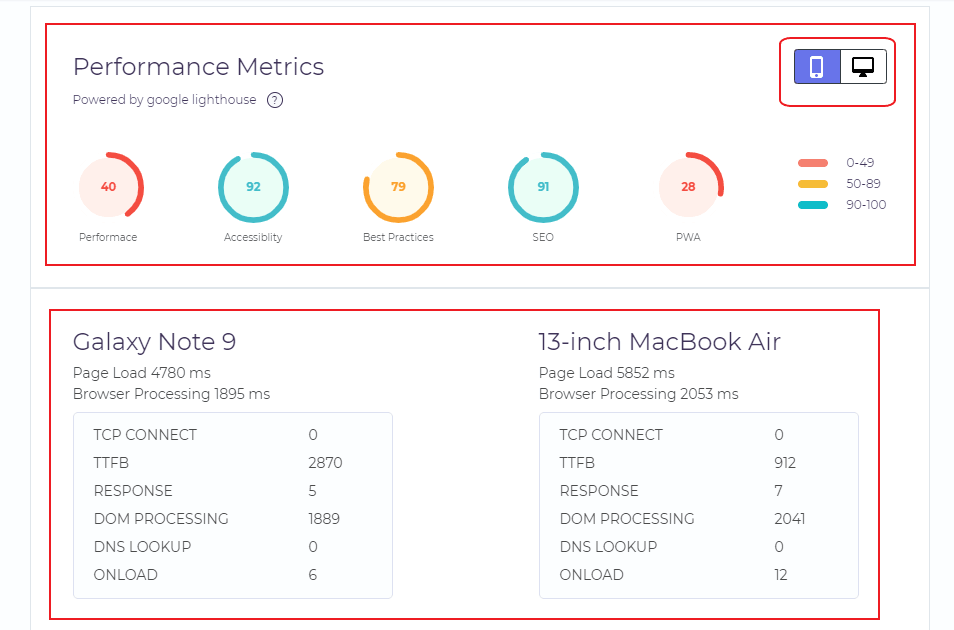
Runtime Settings
In runtime settings, you’ll find the URL of the tested website along with information about the time and date for when it was run on that particular website.

For more help, you can refer to our documentation on Performance Report.
Now Test On Latest Mobile Devices
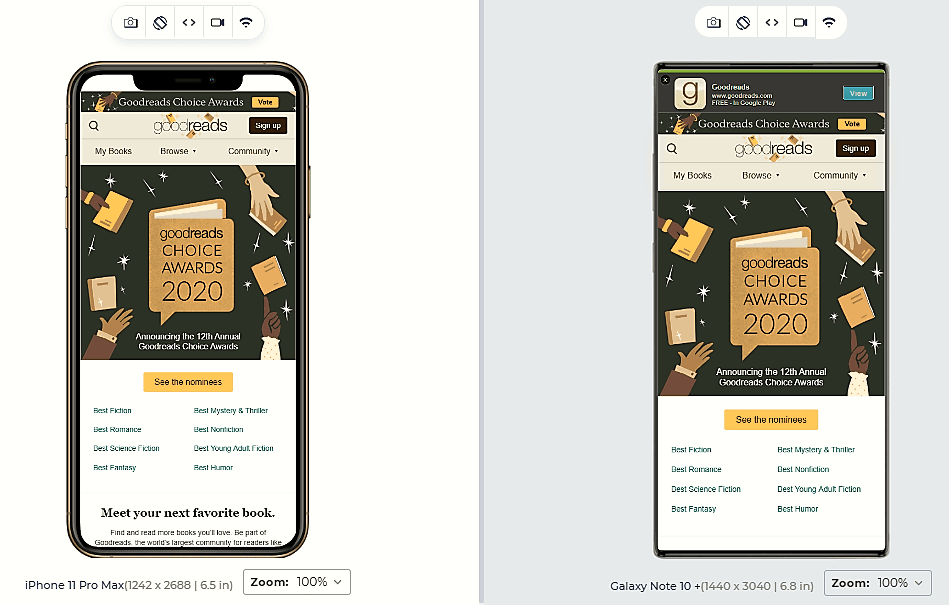
Additionally, we also let you perform responsive tests on a whole new variety of latest devices. We have added three latest iOS devices and one Android device to our selection of Mobile Devices.
- iPhone11 Pro Max
- iPhone 11
- iPhone SE
- Samsung Galaxy Note 10+
New Resolutions For Mac Desktops
You can now check the desktop view of your website on different Mac desktop devices. We have added new resolutions to our Mac desktops-
- 11-inch MacBook Air: 1366×768
- 13-inch MacBook Air: 1440×900
- 13-inch MacBook Pro: 1280×800
- 15-inch MacBook Pro: 1440×900
- 21-inch iMac: 1920×1080
- 27-inch iMac: 2560×1440
Added Keyboard Shortcuts
LT browser will further help you save your time with these four recently added keyboard shortcuts.
- [ : Used to expand and collapse the sidebar.
- Alt+p: For viewing the performance report.
- Ctrl+Alt+r: For replacing or adding a right device.
- Ctrl+Alt+d: For removing the right device.
New Category For ‘Laptop’ In Custom Devices
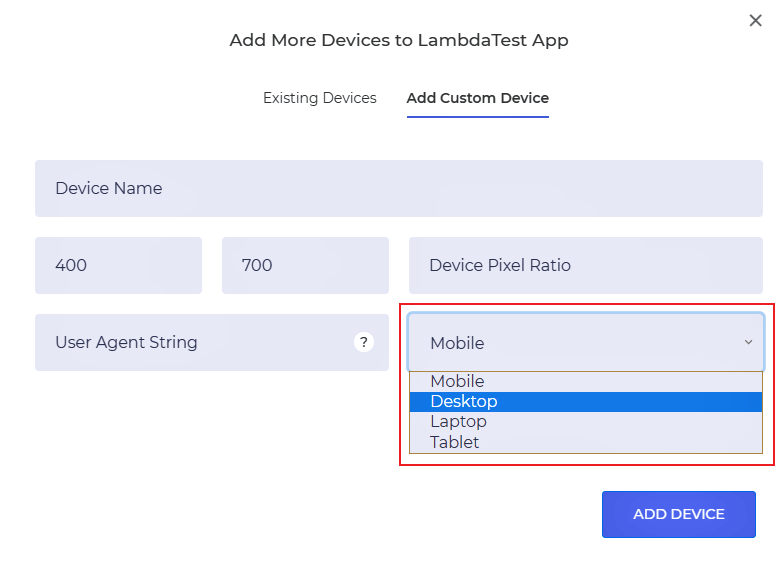
We have added a new category for Laptop in our custom devices. You can now perform responsive tests on laptop devices of your desired resolution.
Added Context Menu For Webview
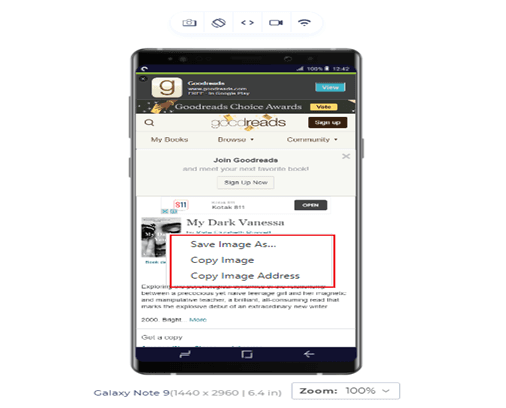
By right clicking, you can now copy the image, save the image on your local system, and copy the image address. Also, you can directly inspect the element from here.
Watch this video to learn about collecting performance metrics in Selenium 4 using the Chrome DevTools Protocol on the LambdaTest platform.
That’s All!
That is all for today, testers. We hope you have a good time testing and elevating your website performance with these cool new features in LT Browser. There’s a lot more where that came from, so stay tuned for more!
If you have any questions or suggestions, please contact us in our 24/7 customer chat support or email us at support@lambdatest.com.
Happy Testing!!!
Got Questions? Drop them on LambdaTest Community. Visit now


