Complete Guide To Memory Leakage Testing In JavaScript
Robin Jangu
Posted On: March 31, 2018
![]() 21848 Views
21848 Views
![]() 4 Min Read
4 Min Read
Introduction
To understand the memory leakage issue, we must first understand how memory is allocated and recycled in a typical web browser operation.
You don’t even have to imagine, just look around. The renting and subletting is similar to memory allocation. The builders and contractors raise a building, and sell or rent the apartments to people in need. The owners in turn live in them or rent/sublet them further for profit. When I was 8 years old, there was a house that had been vacant forever. I would shiver at the thought of entering that ruin, that is what a memory leak is.

A JavaScript code has the same effect, the memory blocks are allocated for the various tasks, and when there is no need of them they return back to the free memory pool. When after using the allocated memory doesn’t get back to the free pool of memory, we define it as a memory leak.
Leaking Bad
Ever wonder why sometimes it takes forever loading a website, it may be because of this memory leakage issue. Memory Leakage greatly affects performance. Too much of leakage can even result in crashing. High latency will take away all your joy if you enjoy gaming. Memory leakage is a serious problem and it must be tackled similarly.
Mark and Sweep
One of the reasons why JS is loved dearly by its users is also because of the fact that it is a garbage collected language.
‘What is Garbage Collected language’ you ask?
Basically it helps you keep track of the previously allocated memory and help you keep the leakage to the minimum and it does that by the simple yet effective algorithm that is called as ‘Mark and Sweep’.
Imagine a network of memory blocks interconnected, now you go to the root and mark all the reachable(referenced) blocks from the root. When it is done, you have all the memory that is allocated to your script. Now the rest of the blocks, which can’t be reached, must not be in use by your script. So they are swept away to the OS and put in the free memory pool. The algorithm seems almost perfect but still there are many ways that leakage still can happen.
Finding Leakage in Memory
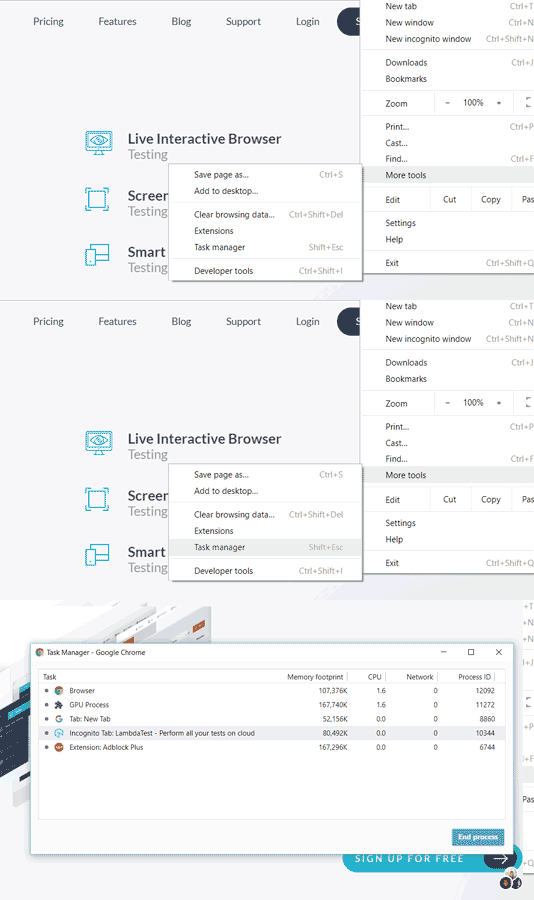
Browsers like chrome provide a variety of solutions to the memory crisis by providing specialized tools to the developers. Using Chrome task manager you can easily manage and keep track of the heap memory(allocated to JS) as well as DOM nodes.It informs you about how much memory the page is using in totality. If the Memory is increasing that means more and more DOM nodes are getting created.
Visualize your memory leaks using the timeline recording feature and even record your data for further comparison of before and after the garbage collection.Heap snapshot is very effective in knowing the DOM nodes creation and keeping in check the leakages due to the faulty scripts.
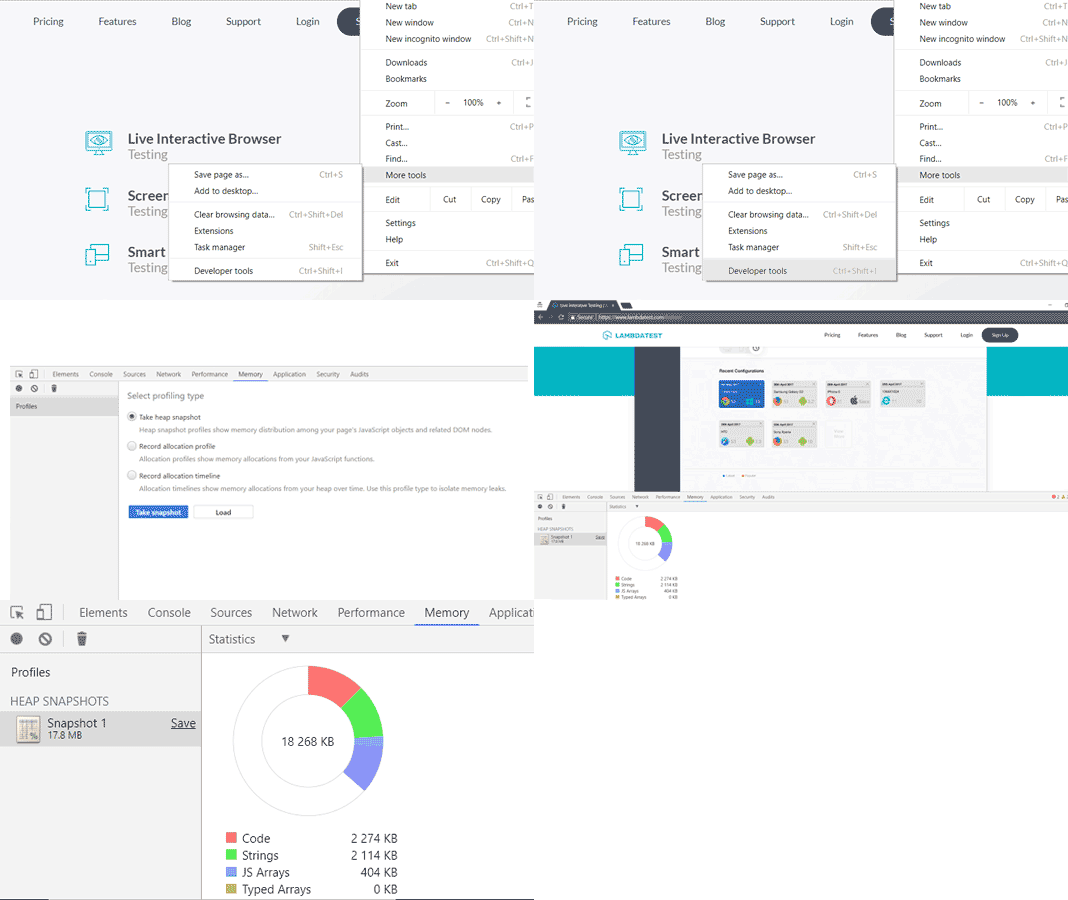
Allocation timelines help when you feel some action causes memory leakage. After clicking the record button, perform the action and then study the graph for unusual memory allocation.
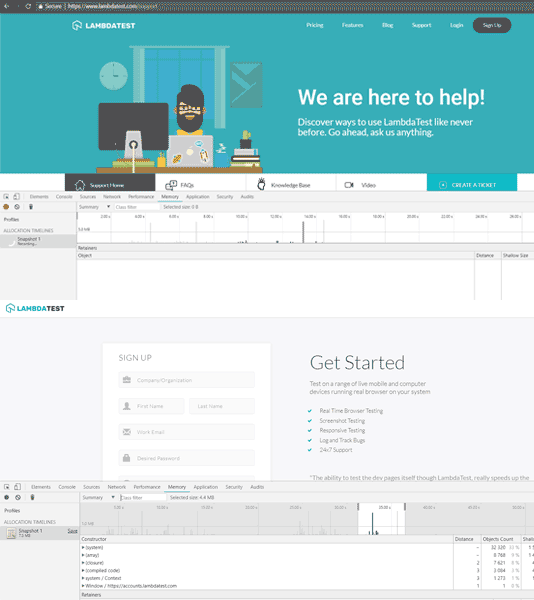
Record allocation profile enables you to investigate further into the memory allocation while performing a suspected leakage task.

Try LT Debug Chrome Extension for debugging websites!
Conclusion
Oscar Wilde once said “Memory is the diary that we all carry about with us”.
In the end we all want web pages to load faster, to work and perform efficiently without putting pressure on your system. To enable that we should follow good practices and follow efficient scripting. In the next few blogs we will discuss what causes memory leakage and how we can eradicate this problem.
Till then, Ciao!
Got Questions? Drop them on LambdaTest Community. Visit now


