Building Automated Testing Pipeline With Semaphore CI And Selenium Grid
Rakesh Vardhan
Posted On: September 1, 2021
![]() 427219 Views
427219 Views
![]() 27 Min Read
27 Min Read
In today’s digital age, product teams must build products at a brisk pace while maintaining the best quality. Therefore, the methodology to follow and the tool selection to accomplish this can be paramount to get better results. Moreover, software applications don’t just support businesses now; rather, they have become an integral part of a business. Hence, it’s obvious that the product teams deliver a product with speed, reliability, scale, security, quality, and improved collaboration. So companies started following the DevOps model, which is a combination of Development (Dev) and Operations (Ops) teams.
DevOps include the practices such as Continuous Integration and Continuous Delivery (CI/CD), Developing Microservices, Adopting Infrastructure as code, Monitoring and Logging the application, and Communication & collaboration within teams. To rapidly develop a product with speed, teams often use SaaS (Software as a Service) solutions that are available to accomplish the required task without the overhead of setting up or maintaining any infrastructure. One such solution available in the market for CI/CD is Semaphore CI.
In the meantime, if you’d like to run your test scripts over a Selenium Grid online then leverage LambdaTest for your test automation.👇
In this article, we’ll learn about Semaphore Continuous Integration and dig deeper into using it for building automated testing pipelines with online Selenium Grid. If you are preparing for an interview you can learn more through Selenium interview questions.
Let’s begin!
Overview Of Semaphore CI
Semaphore CI is one of the few CI/CD tools available to accomplish continuous integration and continuous delivery. Other best CI/CD tools in the same space are Jenkins, Azure DevOps, TravisCI, CircleCI, TeamCity Cloud, etc. Semaphore Continuous Integration tool identifies itself as the hosted CI/CD solution for teams that do not have bottlenecks! It is designed and built around increasing developer productivity and reducing the execution time for any pipeline. As per the official website, Semaphore Continuous Integration is the fastest CI/CD solution available in the market, with the ability to deliver the projects in record time.
Refer below to the benchmarking performance of Semaphore CI for a production-grade web application as compared to other CI/CD tools:
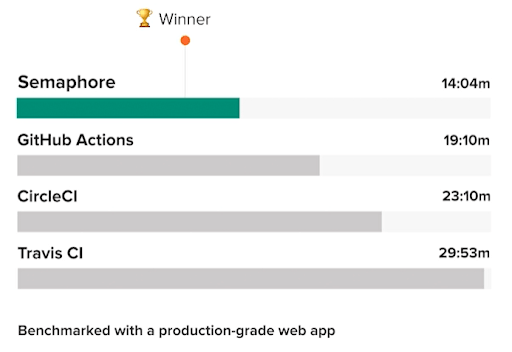
From the above survey, it is clear that the Semaphore CI is the winner in terms of shorter execution time, as it has taken the least amount of time to complete operations in the pipeline.
Now you have understood what Semaphore Continuous Integration is, let’s see some of the best features available in Semaphore Continuous Integration.
Read – Top CI/CD Tools Comparison
Features Of Semaphore CI
Below are some of the important features provided by the Semaphore Continuous Integration tool.
1. Hosted CI solution, no need to manage external servers
2. Flexibility to build from simple sequential build to multi-stage parallel programmable pipelines
3. Flexibility to create our environment with native Docker support
4. Optimize the monorepo workflows
5. Build, test and deploy on different programming languages and platforms.
6. Faster builds with smart caching
7. Support for containerization for pipelines using Docker and Kubernetes.
8. Ability to debug the failures in seconds by implementing SSH into the running jobs
9. Support for all deployment strategies – canary, blue-green, etc. including the option to rollback changes.
10. Built-in Docker registry to store the images.
Before we get into the details of Semaphore CI, let’s brush up on some important concepts around CI/CD. The below video will deep dive into the fundamentals of Continuous Integration, Continuous Deployment, and Continuous Delivery(CI/CD).
However, you can also visit the LambdaTest YouTube channel for videos that will guide you through building an automated testing pipeline using popular CI/CD tools like Jenkins, GitLab, CircleCI, and more.
Getting Started With Semaphore CI
Semaphore Continuous Integration is a commercial CI/CD service offering. It offers three pricing plans for the customers.
1. Free
2. Startup
3. Enterprise Cloud
Though it’s a commercial product, Semaphore CI has a free plan that provides $10 worth of credits (1300 minutes) for running a single job at a time on Linux, macOS, and Docker environments. We will use this option to explore Semaphore Continuous Integration and learn to build pipelines for our test automation examples using cloud Selenium Grid.
The basic prerequisite is that “You need an active GitHub account and a code repository”.
As of now, Semaphore supports creating pipelines for repositories that are hosted on GitHub. However, there is a plan to support repositories in Bitbucket. And supporting other options such as GitLab integration and any git repository is under consideration by the team.
We are using the Demo GitHub repository to discuss examples.
Below are the steps to get started using the Semaphore CI
1. Navigate to Semaphore CI official website and click on the Sign up with GitHub button.
2. Semaphore CI will open up in a new tab. Click on Continue with GitHub button.
3. It takes us to the GitHub authorization page. Authorize the app by clicking on Authorize renderedtext.
4. On the next screen, Semaphore asks you to create an organization. By default, it takes the GitHub username and creates a Semaphore URL for us.
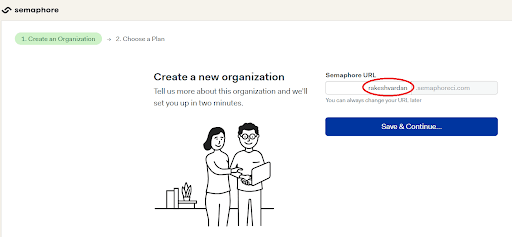
5. Click on Save & Continue.
6. On the next screen, choose the plan for your organization.
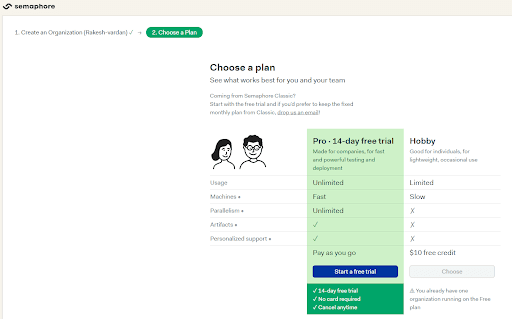
7. We can choose either of the options here. Even for the Pro option, we don’t need to enter any credit card details.
8. Once this is completed, we can see our newly configured organization as below.
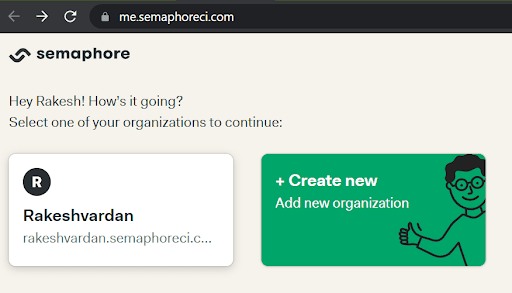
9. Upon clicking on the organization tile, we could see our workspace as below. We could see all of the work that we have been doing in the organization. Since I have already created some pipelines earlier, we can see all these details. If you are creating it for the first time, you can see an option to set up a new project.
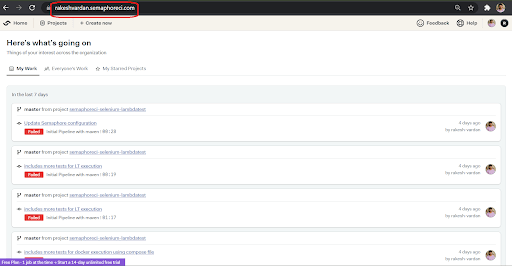
10. Click on the Create New button.
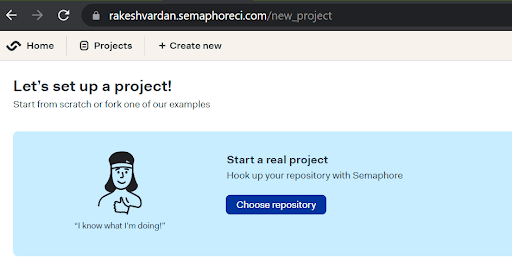
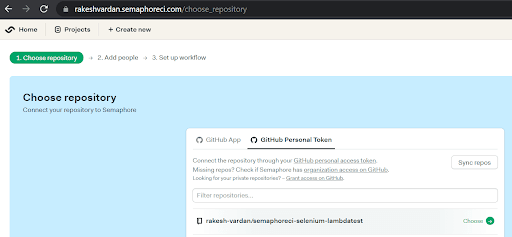
Choose the repository you want to work with. We can either choose the GitHub app or use a GitHub personal token. Let’s select the project and click on Choose.
11. Semaphore initializes the set-up required as below.
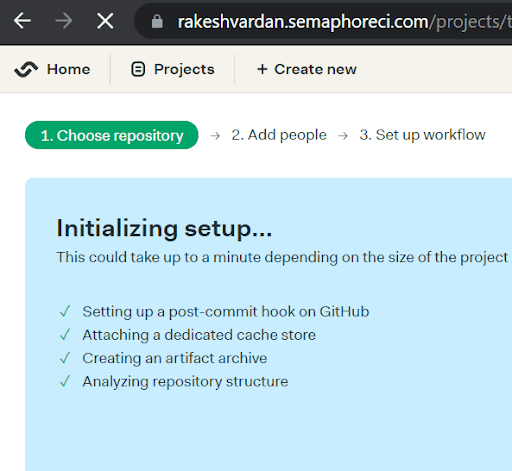
12. We can add collaborators required for the project in the Add People or go to the next page.
13. In the Setup workflow, choose the Single Job workflow and click on Looks good, let’s start button.
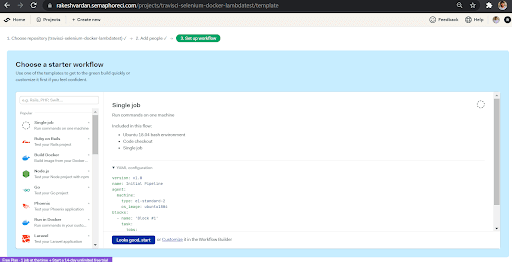
14. Once done, Semaphore Continuous Integration starts the pipeline and executes the jobs inside the pipeline.
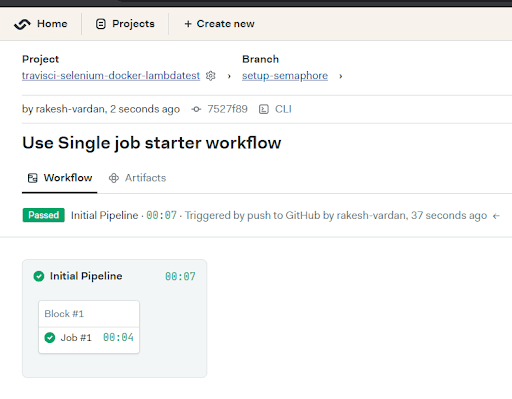
That’s it! This is the entire process of setting up a new account with Semaphore Continuous Integration and creating a new sample pipeline.
In the next section, let’s understand some important concepts and terminology used in Semaphore Continuous Integration and then build new workflows and pipelines.
Important Concepts In Semaphore CI
Similar to other CI/CD solutions, Semaphore Continuous Integration has its own set of terminology while working with pipelines:
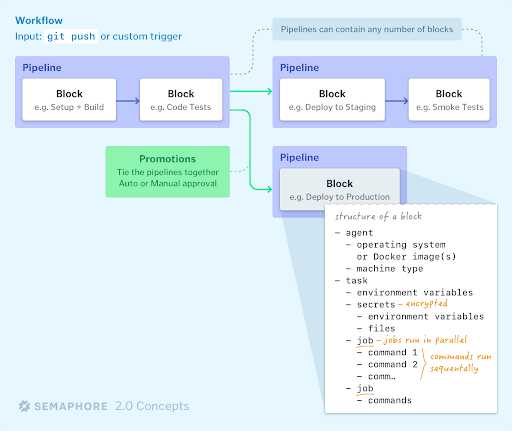
- Workflow: Workflow in Semaphore CI is similar to a Jenkins Pipeline. Semaphore uses pipelines, blocks, tasks, and promotions in the workflow to manage the application CI process. Each workflow for a project can have multiple pipelines.
- Pipeline: A pipeline is a collection of similar blocks within the same workflow.
- Block: Blocks are the building components of a pipeline. Each block in Semaphore CI consists of an optional name and task as a mandatory value. Blocks define steps in the pipeline on what to do as part of the pipeline. By default, all the blocks in the pipeline run sequentially by Semaphore CI. However, we can also define blocks to run in parallel mode by using block dependencies.
- Task (Mandatory): Task specifies what to do in the block. The task consists of jobs, epilogue, prologue, and secrets.
- Job: Jobs in the Semaphore specify the commands to execute in a pipeline. Each job is run in an isolated clean virtual environment created by the Semaphore. Examples include checking out the code, running tests using Maven, etc.
- Promotion: Promotions in Semaphore are the junction blocks used for deployment purposes and promoting builds to different environments.
- Secret: Secrets in Semaphore are used to store sensitive information for a workflow such as API keys, passwords, etc., which are not committed to the version control system.
- Agent: Virtual environment to run the workflows is created by Semaphore, post which it is ready for us to use. These machines are called agents. They perform the actual execution of the job. Each agent consists of a machine type and OS image used to build the agent. Semaphore supports agents on Linux and macOS environments.
The below picture from the official Semaphore documentation gives a high-level overview of these concepts.
Building A Pipeline With Semaphore CI
If you have noticed in the getting started section, Semaphore has created a new branch called setup-semaphore and added a configuration file semaphore.yml in the .semaphore directory in our project. Basically, the idea here is to create a pull request to the master/main branch from the setup-semaphore branch once all the pipeline steps are defined.
Based on the pull request trigger, which is configured by default, Semaphore starts the workflow and executes the jobs within the pipeline.
We have created the pull request to master and we will be working in the master branch only for all our examples.
There are two options available to create a new workflow in Semaphore.
1. Using the Visual Builder
2. Using the declarative YAML configuration in semaphore.yml
Let us first start configuring our workflow using the Visual Builder. But, before that, let’s try to understand the test scenario that we are trying to configure in Semaphore Continuous Integration.
1. Open a specified browser.
2. Open the GitHub page and verify the title.
3. Open the Gmail page and verify the title.
4. Open the LambdaTest page and verify the title.
We have set up our Selenium automation project and TestNG to run the tests in any browser. We use the BrowserFactory and BaseTest to instantiate the browser based on the input and pass it on to our tests. Please refer to the Demo GitHub repository for complete project code.
We are using TestNG and adding appropriate annotations for our tests. We have also configured the testng.xml file to include what tests to run.
|
1 2 3 4 5 6 7 8 9 10 11 12 |
<?xml version="1.0" encoding="UTF-8"?> <!DOCTYPE suite SYSTEM "http://testng.org/testng-1.0.dtd"> <suite name="All Test Suite"> <test verbose="2" name="firefox tests"> <parameter name="browser" value="LOCAL_FIREFOX"/> <parameter name="gridHubURL" value="http://localhost:4444/wd/hub"/> <classes> <class name="org.lambdatest.FirstTest"/> <class name="org.lambdatest.SecondTest"/> </classes> </test> </suite> |
Finally, we will use the below maven command to trigger the tests.
mvn clean install -DsuiteXmlFile=testng.xml
Complete code for this project is available here on the GitHub repository.
Adding A Pipeline With Visual Builder
With all the prerequisites in place, let’s start with our first pipeline using the Visual Builder in the Semaphore CI.
Go to the organization URL, and open the project that we have imported from GitHub. Select the branch as master and click on the edit workflow button.
We can see the values below for the pipeline section.
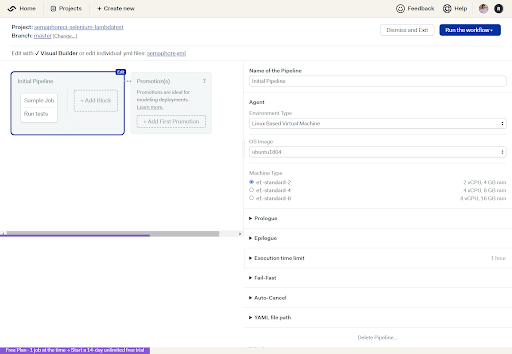
As we see here, Semaphore has chosen default values for The Agent, OS Image, and the Machine types. If needed, we can change these values and proceed with creating the Job. If any other steps need to be performed before and after running the pipeline, we can configure the commands in the Prologue and Epilogue sections, respectively.
For now, let’s take all the default values and change the name to First Pipeline in Semaphore and click on the Job.
Add a name for the block, give the specified commands in the jobs section and keep other values at their defaults. Here the command checkout is mandatory to clone the repository and create the workspace. The next one is the maven command that we need to run our UI tests in Selenium.
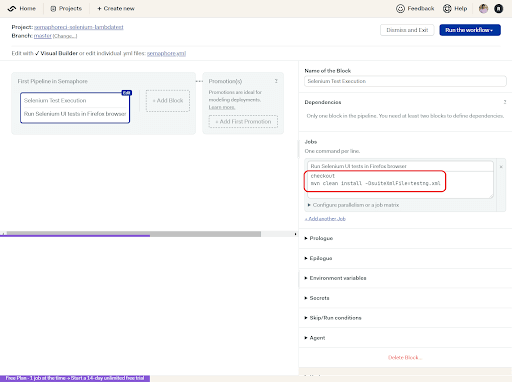
Click on Run the workflow. Semaphore asks to commit the changes to the code repository. Add a comment and click on Looks good, let’s go. Semaphore initiates the workflow and starts executing the job that is configured for our project. As we observe in the below screen, the workflow is in Running status.
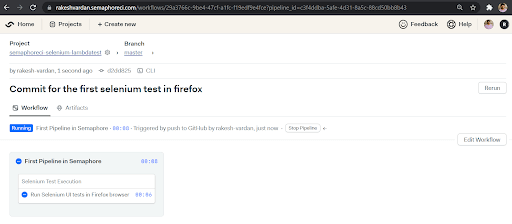
Once the workflow is completed, we could check the logs as below. Next, the Semaphore starts creating the fresh virtual environment for our job, loads all the required variables, if any, checks out the code from the repository, and runs the build commands specified.
From the below screen, we could observe that our pipeline execution is successful, and all our tests are passed!

Here is the summary of the tests that are executed as part of our job.

Finally, the status is updated as Passed at the workflow level.

Configuring A Pipeline With semaphore.yml
In our previous run, we have leveraged the Visual Builder option available in Semaphore CI to add the configuration for the pipeline. However, you can also add the configuration using a declarative YAML file – semaphore.yml
You have to click on the Edit workflow button and then click on the semaphore.yml file to open the configuration file on the web. We can see the below configuration is automatically available for us. It is because of the configuration we did using the visual builder option in the previous step. Therefore, the same instructions are replicated here.
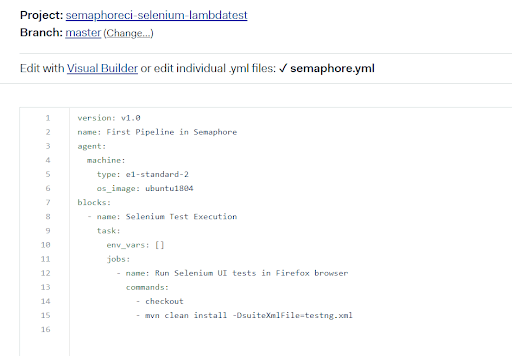
Let’s look at the configuration in detail.
- version – version refers to the pipeline YAML version used in the configuration
- name – the name of the pipeline
- agent – agent defines the virtual environment, i.e., software and hardware that needs to be created to run our job
- machine – machine property is added to the agent only, and it has two properties – type and os_image
- type – virtualized hardware that is available for us to use in jobs
- os_image – operating system to be used for the jobs
- blocks – blocks define steps in the pipeline on what to do as part of the pipeline
- task – the task is a mandatory property in blocks which refers to the steps needed inside a block
- env_vars – key-value pair that holds the environment variables as part of a job
- jobs – property where we mention the actual commands to be executed along with a name to it
- commands – an array of strings that holds the commands to execute for a job
Now that we have understood the semaphore.yml configuration let’s discuss the next example. We use the below semaphore.yml file for our next pipeline execution and see if we could run the pipeline in Semaphore Continuous Integration. As you observe, we are running our tests in the Chrome browser this time.
Semaphore.yml file
Some of the new properties are mentioned below:
- prologue – This is executed before the commands of each job of a task item. In our example, we have added the checkout command to the prologue block to check the source code before our test execution.
- epilogue – This is executed after the commands of each job item of a task. Semaphore has a beta feature at the moment to publish the test results from the pipeline execution without any additional configuration. However, since we are using TestNG in our example, we get the XML reports post-execution. Hence we configured the XML files as part of the epilogue block to check the execution results in a more readable way.
Also, we are passing the browser property to the test suite using the below maven command.
mvn clean install -DsuiteXmlFile=testng.xml -Dbrowser=LOCAL_CHROME
Once the pipeline is executed with the new configuration specified in the semaphore.yml file, we can see the below log. Our execution is successful even in the Chrome browser also!
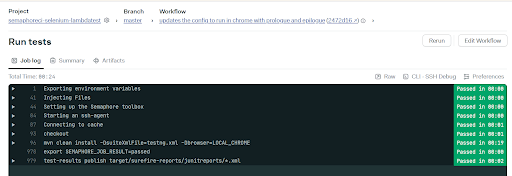
From the logs, we could see that the Chrome browser instance is launched.
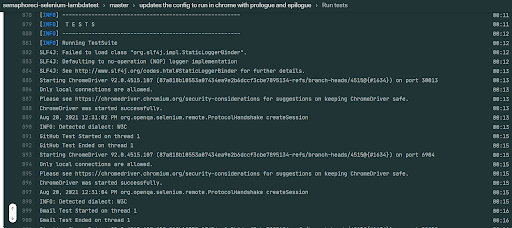
And the tests are executed successfully.

The workflow view is shown below:
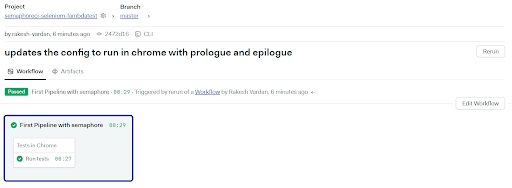
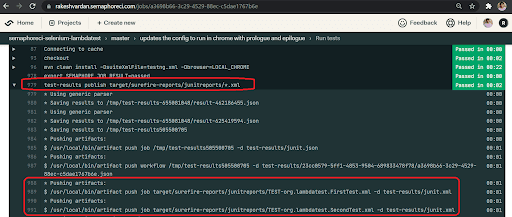
Please take a look at the expanded logs for the test results publishing command that we specified in the epilogue section. In addition, Semaphore is publishing the JUnit XML results to the summary page.
Navigate to the Summary tab, and we can see the detailed test execution results there.
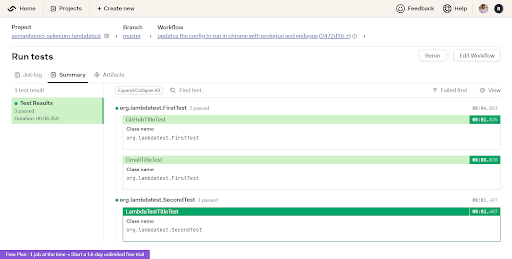
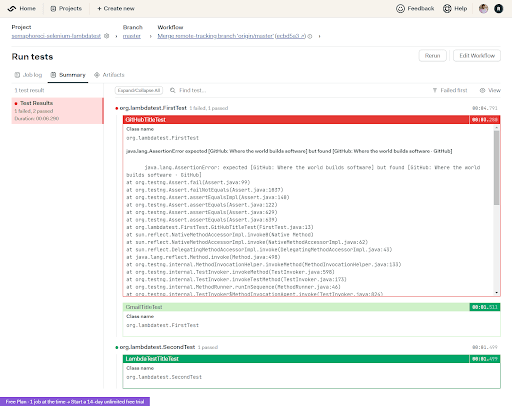
If there is a failure in our tests, the view displays below – with the details to easily debug the issue.

Building A Complex Workflow With semaphore.yml
With the knowledge that we have acquired till now, we could run the pipelines in the Semaphore Continuous Integration tool. We have discussed using Visual Builder and semaphore.yml to create and run a simple UI test pipeline. How about taking our experience to the next level and creating a complex workflow for our project? Let’s see how we can do it.
Add the below code in the semaphore.yml file and run the workflow.
Semaphore.yml file for complex flow – sequential
From the workflow overview page, we could see the below execution summary. First, the project is built, then the API smoke tests are executed, then the UI tests are executed in Firefox browser followed by UI test execution in Chrome browser.
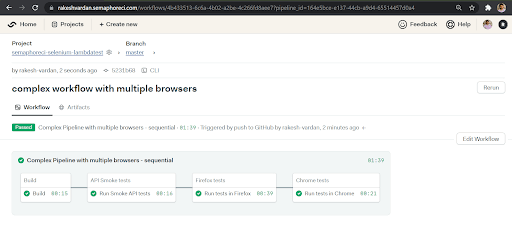
We are using the env_vars property for storing the maven local repository path. The env_vars property is a key-value pair with the name and value for the variable. Next, we are using the Semaphore CI caching feature to cache and reuse the project dependencies.
We have used the cache store command to store the cache and cache restore to restore the saved cache. As you have noted, along with our previous UI tests using Selenium, we have added a simple API test as part of our
suite using REST Assured library. And we configured to run the API tests using a separate TestNG XML file – testng-api.xml
Since we haven’t declared any dependencies between the jobs inside the block, the jobs are executed in sequential order by default one after the other. So let’s tweak our semaphore.yml as below and see if we can run the same in parallel mode.
Add the below code in the semaphore.yml file and run the workflow.
Semaphore.yml file for complex flow – Parallel
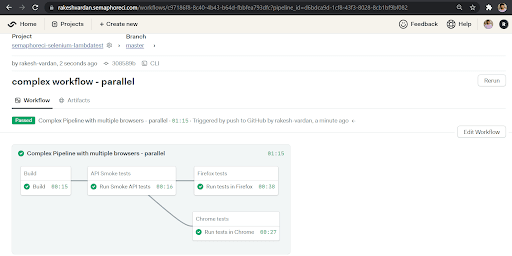
From the workflow overview page, we could see the above test execution summary. First, the project is built, then the API smoke tests are executed. As per the semaphore.yml configuration, we have added API Smoke tests as the dependency for jobs to run Firefox tests and Chrome tests.
As soon as the API Smoke tests job is completed, Semaphore triggers the other jobs simultaneously (i.e. the UI tests are executed in Firefox browser and Chrome browser simultaneously). This small configuration change enables the execution of the builds in less time and improves the overall efficiency of the pipelines. Therefore, we could achieve parallel execution without any code changes on our project, along with zero changes in testng.xml.
Semaphore CI Pipeline With Docker
Till now, we have been running our tests on the browsers launched in the virtual infrastructure created by the Semaphore CI. Semaphore Continuous Integration also has native support to create and run the pipelines using docker. Docker CLI is already installed in all Semaphore virtual machines; hence we can use it without additional configuration. Let’s modify our configuration to run the same pipeline in browser containers launched by docker. Docker is one of the most widely used containerization technologies. To learn more about Docker and execute UI Selenium tests using Docker, please refer to our detailed article on how to run Selenium tests in Docker.
Add the below code in the semaphore.yml file and run the workflow in docker.
Semaphore.yml file for complex flow – Docker Containers
As you take a look at the semaphore.yml configuration, there are some minor changes that we have made to enable the execution in docker containers. We will use the below docker run commands to spin specific browser containers on port 4444 and point our tests to run on the relevant grid hub URL with maven arguments.
|
1 |
docker run -d -p 4444:4444 -v /dev/shm:/dev/shm selenium/standalone-firefox:4.0.0-rc-1-prerelease-20210618 |
|
1 |
mvn clean install -DsuiteXmlFile=testng.xml -Dbrowser=GRID_FIREFOX -DgridHubURL=http://localhost:4444/wd/hub |
|
1 |
docker run -d -p 4444:4444 -v /dev/shm:/dev/shm selenium/standalone-chrome:4.0.0-rc-1-prerelease-20210618 |
|
1 |
mvn clean install -DsuiteXmlFile=testng.xml -Dbrowser=GRID_CHROME -DgridHubURL=http://localhost:4444/wd/hub |
Once the execution is completed, we can see the workflow overview as below.
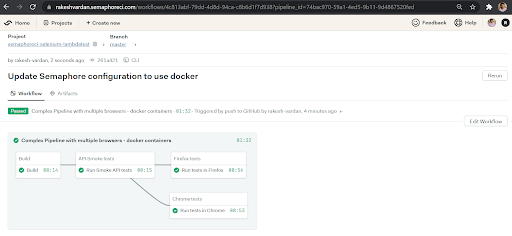
If we take a look at each of the jobs for our UI tests that are using docker containers to execute the tests, we can see the below log information.
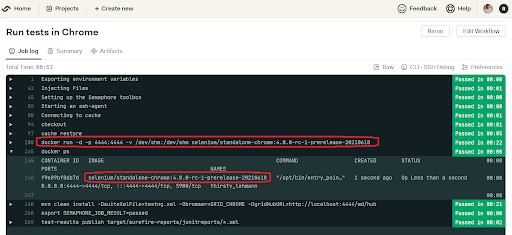
Docker starts the stand-alone firefox container on port 4444 as we see in the output of the docker ps command. Then, using the gridHubURL we have sent the test requests to the container on the same port. Hence the tests are executed successfully on Firefox containers and the result is passed.
Similarly, the Chrome container is started on port 4444, tests are executed and the execution is passed.
Read – How To Run Selenium Tests In Docker?
Semaphore CI Pipeline With docker-compose
We have seen multiple examples of building test automation pipelines till now. We would be able to use Docker for spinning up the containers and executing our tests in them. Let us take this forward and explore building the automation pipelines with docker-compose in Semaphore CI.
Docker-compose is a utility provided by Docker for defining and running the multi-container docker applications. We have specified all the instructions required to start the services in a declarative YAML file and trigger it with a simple docker compose up command.
Let’s modify our configuration to run the same pipeline in browser containers launched by the docker-compose. First, we need to add the below code in the semaphore.yml file and run the workflow.
Semaphore.yml file for complex flow – Docker-Compose
Once the execution is completed, we could see the below details on the workflow overview page.
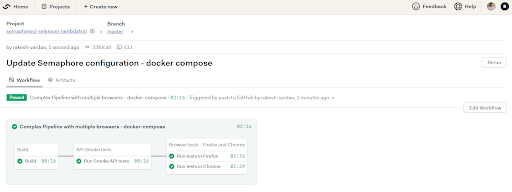
If you have noticed the semaphore.yml configuration file, there is a change in the way we set up the browser containers. We are using the below commands with docker compose and starting the required services.
|
1 2 3 |
$ curl https://gist.GitHubusercontent.com/rakesh-vardan/c1dcf6531b826fad91f18c285d566a71/raw/ad90a18fe5e70f2d6aea06621b76d6e0329a4aab/docker-compose-sel.yml > docker-compose.yaml $ docker-compose up -d $ docker-compose ps |
We have added the services in the docker-compose.yml file and downloaded the content for our execution. Once it is available in the build path, we have invoked the docker-compose up command to start the services using docker.
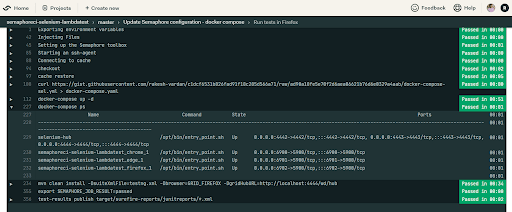
From the log, we could observe that there are 4 containers created for Chrome, Edge, and Firefox browsers and Selenium hub. Since the hub is running on port 4444, we have redirected our test requests to the same hub URL.
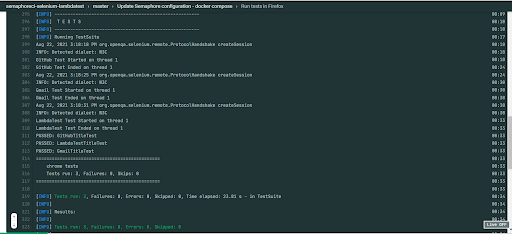
As per the below screen, the tests have been executed successfully.
There is one difference in the configuration in this example. If you have observed, we have added the docker-compose commands in the prologue section of the task only, and instead of creating a separate block for each UI test, we have added multiple jobs in the same block itself. This is because all jobs in Semaphore run in an isolated environment in virtual machines. So the services that start in one job are not automatically available to other jobs in the workflow. So to share the services across, we have added the commands in the prologue section.
Building Semaphore CI Pipeline With LambdaTest
We are good with our previous examples and can execute the tests in Semaphore pipelines. However, suppose we have requirements for viewing the execution live, checking the execution logs, parallel execution, and recording execution sessions. In that case, this functionality is not readily available for us to include in our example. So, either we need to change the code or set up additional tools to enable this feature for our pipelines. So do we have a solution here? Yes, we can use a cloud Selenium Grid like LambdaTest.
LambdaTest is a cross browser testing cloud platform to perform automation testing on 2000+ combinations of real browsers and operating systems. It is very easy to configure a project using LambdaTest and start leveraging the benefits out of it. So, let’s integrate our pipeline with the LambdaTest cloud grid solution and see how it’s working.
To start using the LambdaTest cloud, navigate to the LambdaTest Registration Page and sign-up for a new account (which is free to start with!). Once the LambdaTest account is activated, go to the LambdaTest Profile Section and note the username and access key. We would need this LambdaTest username and accesskey to execute our tests on the LambdaTest platform.
Let’s modify our configuration to run the same pipeline in browsers launched by the LambdaTest cloud grid. Add the below code in the semaphore.yml file and run the workflow.
Semaphore.yml file for complex flow – LambdaTest
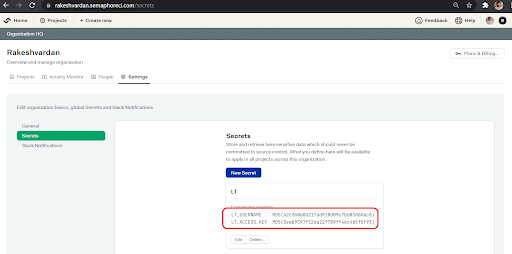
Before triggering the build, we need to make sure that the below environment variables are set as secrets in the project settings in Semaphore CI. Secrets in Semaphore Continuous Integration are the objects that have global scope within an organization. These secrets can be accessed by the jobs or pipelines to which they have been connected.
|
1 2 |
LT_USERNAME - Username from the LambdaTest profile page. LT_ACCESS_KEY - Access key obtained from the LambdaTest profile page. |
The grid hub URL is formed based on the values that we set in the environment variables, as shown below:
|
1 |
https://<username>:<accessKey>@hub.lambdatest.com/wd/hub |
Where username is the Username, accessKey is the access key from the LambdaTest account.
Once the execution is completed, we could see the below details on the workflow overview page in the Semaphore CI.
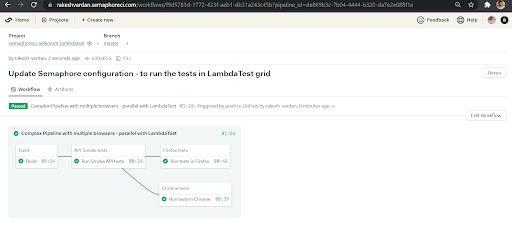
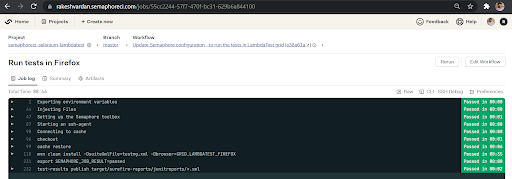
And from the detailed logs, we could see that the execution is successful in Firefox and Chrome browsers. Furthermore, we can also see the command used to execute the tests.
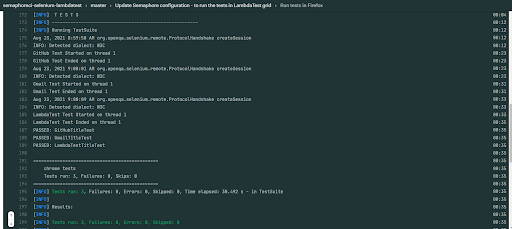
This looks good, but how about the execution statistics and information. Once the Semaphore CI completes the test execution, we can navigate to the LambdaTest Automation Logs to see our test execution in the Timeline view. To navigate to the Automation logs view, click on the test case to see other details such as execution recording, logs, etc.
As we observe, we can see that 2 out of 5 parallel sessions are running in LambdaTest – one is on Chrome browser, and another is on Firefox browser.
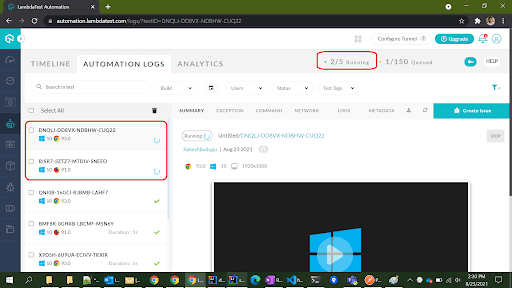
We could observe that 6 tests are executed in browsers available on the LambdaTest cloud grid from the timeline view.

Here is the detailed view of automation logs, along with a recording of the test execution. Of course, we could also build very useful analytics like coverage, pass-failed ratio, and minutes consumed, etc., from the test execution results and build ready-to-use metrics.
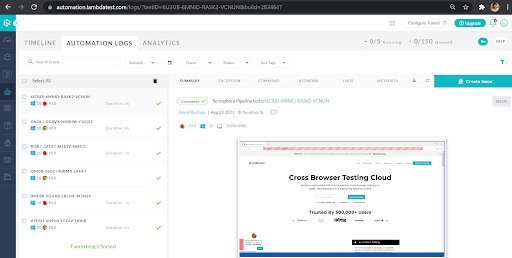
Isn’t it interesting? Without any code changes on our part, we can easily integrate our automation suite with LambdaTest’s cloud grid solution and benefit from the features that it provides to us.
Semaphore CI Additional Capabilities
Let’s throw some light into some of the additional capabilities provided by the Semaphore CI. First, we will discuss the command-line options and the REST API provided by the Semaphore Continuous Integration tool.
Command Line Interface(CLI)
Semaphore command line interface(CLI) is called sem. It enables us to create and manage the Semaphore projects and resources directly from the command line terminal. Sem is a very powerful CLI utility that comes with the power of managing all the resources of Semaphore – workflows, pipelines, jobs, blocks, organizations, etc.
To get started using the sem cli, open a terminal either in a Linux machine or a macOS machine. Currently, the sem cli is not available to Windows OS. Issue the below command to download and run the script to have the cli available on your machine.
curl https://storage.googleapis.com/sem-cli-releases/get.sh | bash

Once done, use the sem connect command along with the organization token to connect to the organization.
sem connect ORGANIZATION.semaphoreci.com ACCESS_TOKEN
Get your access token from the below page in Semaphore CI. If there is no token available for your account, create one for yourself using the Generate API token button.
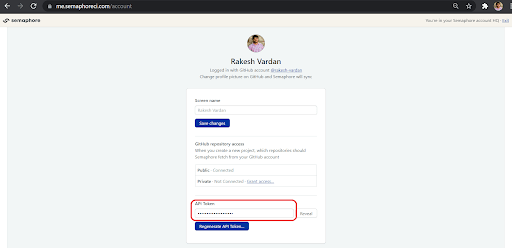
Once you are connected to the required organization, we can issue the sem commands to manage our resources in Semaphore CI. Check the available option using the sem –help command.
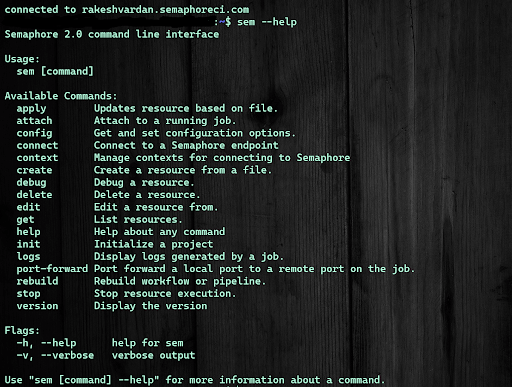
Let us see if we can get all the pipelines available in our project. So issue the sem command as below along with the project name. So we could see all the pipelines that we have used till now along with their details.
sem get pipelines -p semaphoreci-selenium-lambdatest
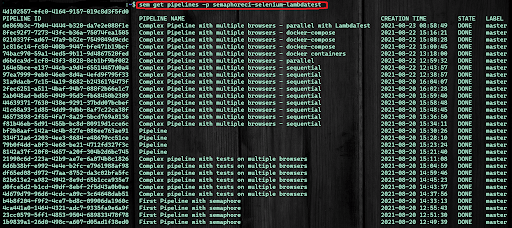

As we see below, we can check all the logs generated as part of the specific job.
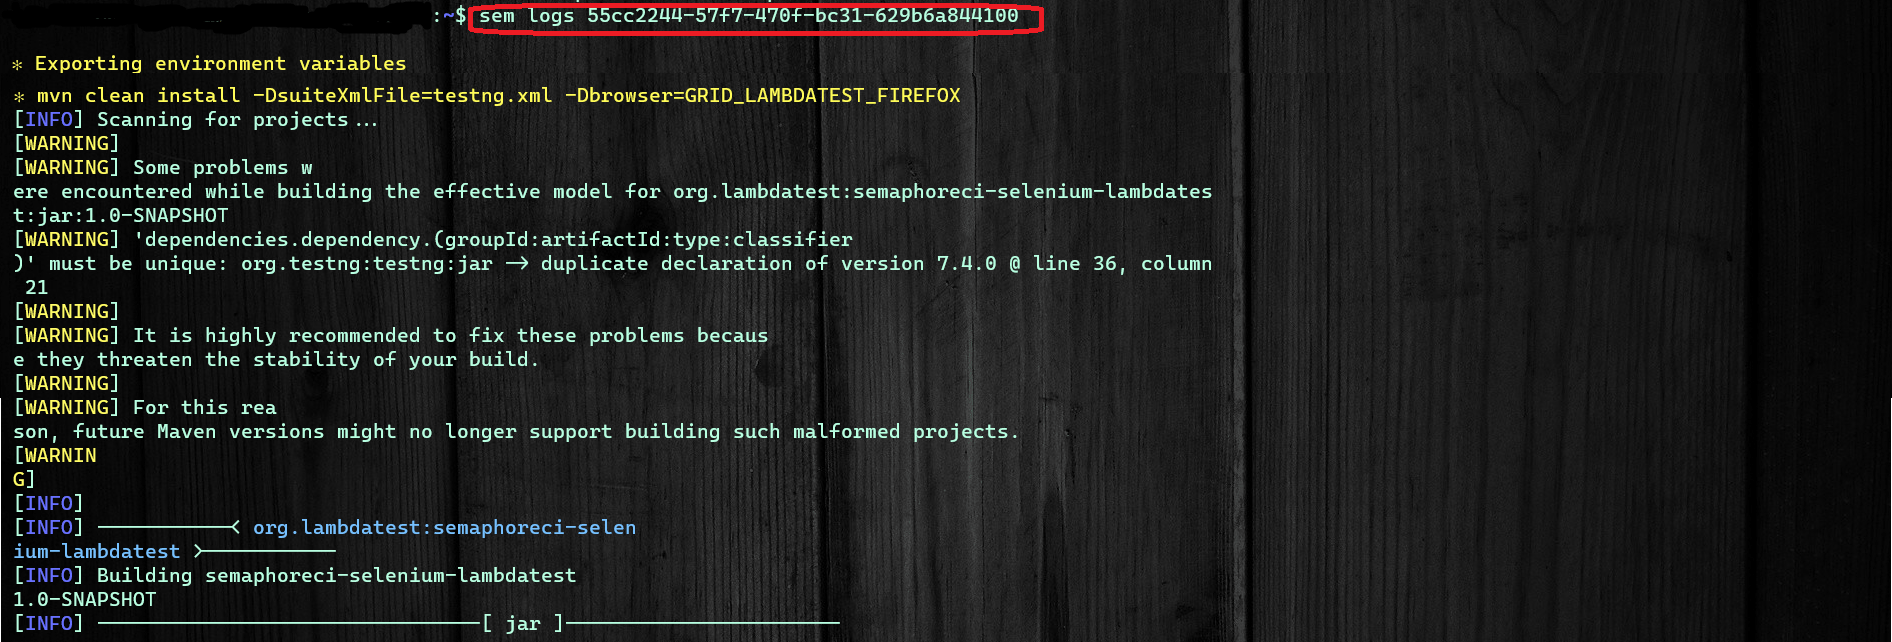
Most of the actions we perform on the Semaphore web interface can be performed using the command line option sem. Please refer to the official Semaphore CLI documentation to get other available options in sem CLI.
Conclusion
Thank you for reading our detailed article on building test automation pipelines using Semaphore CI. We discussed different approaches for creating the workflows in Semaphore, starting with a simple one. Then we discussed the complex pipelines of both sequential and parallel execution. We have also discussed leveraging docker in our pipelines, including the docker-compose utility. Finally, we discussed integrating the workflows with the cloud grid solution – LambdaTest. As part of our examples, we have covered some of the essential concepts from Semaphore CI like workflows, blocks, jobs, pipelines, and secrets, etc. We also touched upon using the Semaphore Continuous Integration using the CLI and REST API. We hope this article can help you get started with building pipelines with Semaphore CI.
Happy Testing!
Frequently Asked Questions
Is Semaphore CI free?
Semaphore’s open source builds are 100% free to use for up to 100 builds per month. This allows teams to experiment with the open-source build or run redundant tests in parallel. Thus, you can either prototype two private projects or branches at once or run one build with tests split into two parallel jobs.
What is semaphore CI CD?
The Semaphore CI/CD platform is the fastest continuous integration and delivery (CI/CD) platform on the market, powering the world’s best engineering teams. You can use Semaphore CLI to start builds, inspect logs, SSH directly into jobs, or create custom dashboards.
Got Questions? Drop them on LambdaTest Community. Visit now


