Debugging Selenium pytest Failures
Paulo Oliveira
Posted On: October 9, 2023
![]() 199830 Views
199830 Views
![]() 36 Min Read
36 Min Read
This article is a part of our Content Hub. For more in-depth resources, check out our content hub on pytest Tutorial and Selenium pytest Tutorial.
Resolving test failures is essential for a reliable test system with testing frameworks like Selenium and pytest. The challenge often lies in recognizing and rectifying the root causes of these failures, which can involve dynamic web elements, timing issues, browser differences, and how we identify elements.
Effective debugging allows developers and testers to quickly pinpoint the root causes of test failures. Instead of spending extensive time searching for issues, they can efficiently identify and address problems, reducing debugging time and effort.
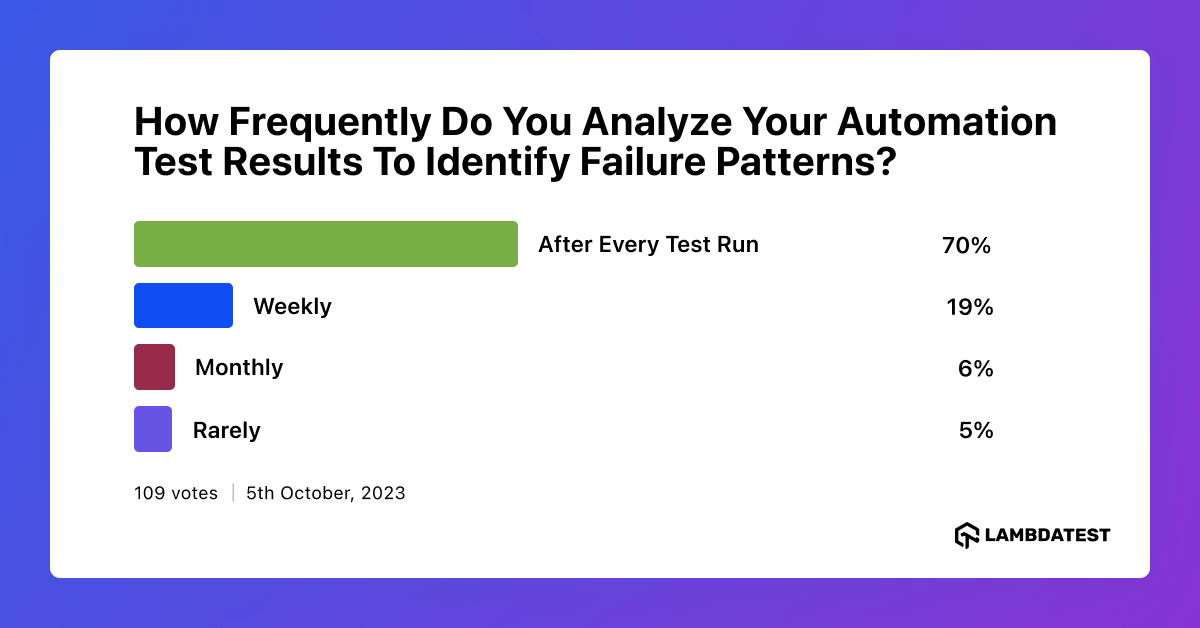
In a recent poll on LambdaTest social media platform, respondents were asked about the frequency of analyzing automation test results to identify failure patterns. The results revealed a noteworthy trend, with a majority expressing a commitment to analyzing results After Every Test Run. This proactive approach underscores the community’s dedication to ensuring the reliability and efficiency of automated testing processes.
This Selenium pytest tutorial will explore common challenges in dealing with Selenium pytest failures. We’ll also share practical debugging tips and best practices to fix and prevent these issues.
If you’re looking to improve your Selenium interview skills, check out our curated list of Selenium interview questions and answers.
TABLE OF CONTENTS
Common Challenges in Selenium pytest Failures
Test failures are a natural part of any test automation journey, including projects involving Selenium and pytest. Debugging can become increasingly challenging as the tested systems become more distributed and complex.
Now, let’s delve deeper into the typical difficulties testers and developers encounter when dealing with Selenium pytest failures. Some of them are:
- Flaky Tests
- Dynamic Web Elements
- Synchronization
- Cross-Browser Compatibility
- Environment Dependencies
- TimeoutException
- ConnectionError
- HTTPError
- ElementNotInteractableException
- StaleElementReferenceException
Let us look into each of the Selenium pytest failures in more detail.
Flaky Tests
Flaky tests, often encountered in Selenium pytest failures, can be incredibly frustrating in test automation. It’s essential to figure out why they happen and how to fix them to keep your tests reliable. Resolving flaky tests involves meticulous investigation and implementing strategies like retry mechanisms, stable test environments, and careful test data management to ensure reliability and effectiveness.
Dynamic Web Elements
Web applications often have dynamic content and elements that load asynchronously. Identifying and interacting with such elements during Selenium pytest failures test execution can lead to unexpected failures. When you encounter dynamic content and elements that load at different times, a common exception you might face is NoSuchElementException.
We will consider executing a code to understand how NoSuchElementException may occur. In this case, we have used Selenium version 4.11.
|
1 2 3 4 5 6 7 8 9 10 11 12 13 14 15 16 17 18 19 20 21 22 |
from selenium import webdriver from selenium.webdriver.common.by import By from selenium.common.exceptions import NoSuchElementException def test_no_such_element_exception(): # Set up the webdriver driver = webdriver.Chrome() # Navigate to a web page with the dynamic content driver.get("https://www.lambdatest.com/selenium-playground/simple-form-demo") try: # Attempt to locate a dynamic element that might not be present dynamic_element = driver.find_element(By.ID, "important-message") except NoSuchElementException as e: print("NoSuchElementException occurred:", e) finally: # Close the webdriver driver.quit() |
Before we proceed to the code’s outcome, let’s first understand the objectives of this set of instructions by breaking them down step by step:
Step 1: The script tries to locate a web page element using its ID, which is important-message.
Step 2: If this element doesn’t exist on the web page (as is the case here), it leads to an expectation called NoSuchElementException.
Step 3: To manage this situation, the code uses a try block to capture this error.
Step 4: If a NoSuchElementException occurs, the except block takes over and prints an error message.
Step 5: This approach handles situations where the expected element is not found in a considerate manner. It helps in dealing with such problems delicately.
Result:
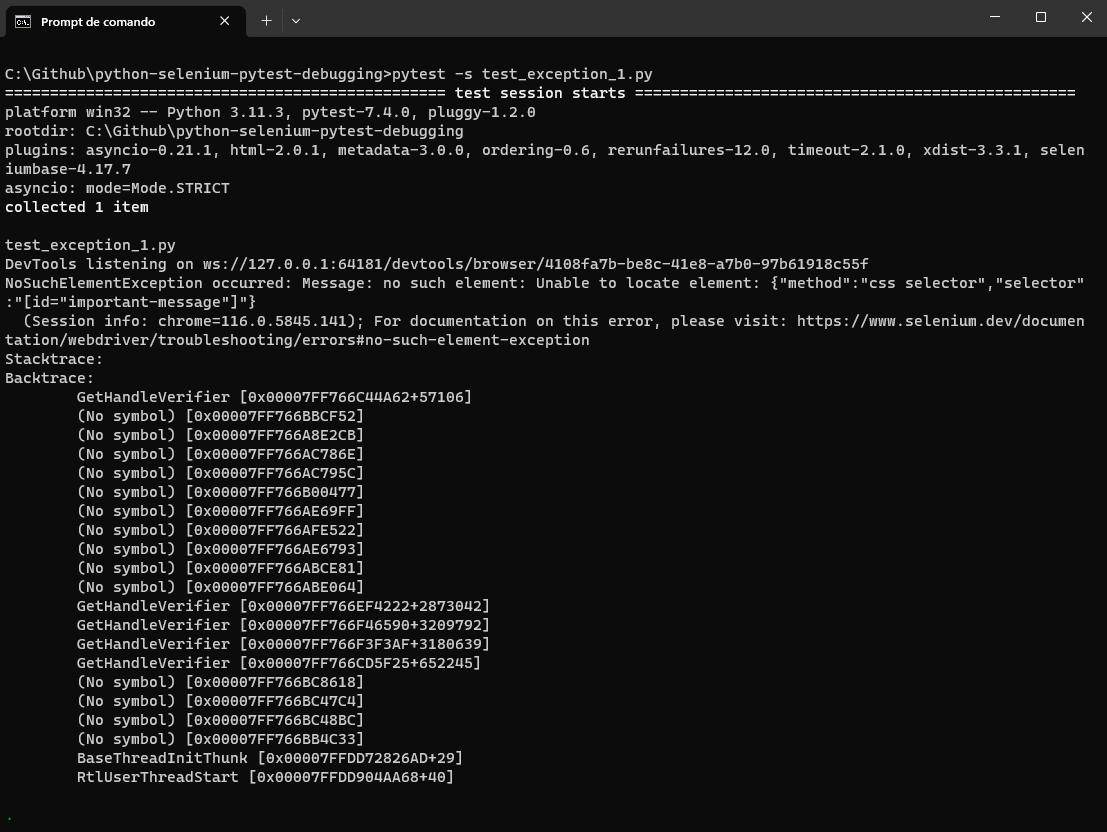
To summarize, this code illustrates how the NoSuchElementException can occur when attempting to locate an element that is either dynamic, hasn’t loaded, or is not present on the page.
Synchronization
The synchronization problems in Selenium pytest failures arise when there’s a mismatch between the test script and the web application’s timing. For example, engaging with an element before it has completely loaded can cause failure.
In this case, involving synchronization issues where the test script tries to interact with an element before it’s fully loaded, a common exception known as TimeoutException may be raised.
Let us understand TimeoutException, by executing some instructions.
|
1 2 3 4 5 6 7 8 9 10 11 12 13 14 15 16 17 18 19 20 21 22 23 24 25 26 27 28 29 |
from selenium import webdriver from selenium.common.exceptions import TimeoutException from selenium.webdriver.common.by import By from selenium.webdriver.support.ui import WebDriverWait from selenium.webdriver.support import expected_conditions as EC def test_timeout_exception(): # Set up the webdriver driver = webdriver.Chrome() # Navigate to a web page with a dynamically loading element driver.get("https://www.lambdatest.com/selenium-playground/simple-form-demo") try: # Wait for a dynamically loading element to become visible wait = WebDriverWait(driver, 10) element = wait.until(EC.visibility_of_element_located((By.ID, "important-message"))) # Interact with the loaded element element.click() except TimeoutException as e: print("TimeoutException occurred:", e) finally: # Close the webdriver driver.quit() |
Let’s first understand the objectives of this set of instructions by breaking them down step by step before we look into the code’s outcome.
Step 1: The script navigates to a web page.
Step 2: It patiently waits for a specific element on the page, identified by its ID, important-message.
Step 3: To ensure the element becomes visible, it utilizes a particular WebDriverWait class and checks for a condition called visibility_of_element_located.
Step 4: If this element doesn’t become visible within a specified time limit (in this case, 10 seconds), it triggers a TimeoutException. It occurs because the script expected the element to appear but didn’t within the allotted time.
Step 5: To manage this situation, the code employs a try block to catch the TimeoutException.
Step 6: If the TimeoutException occurs, the except block comes into play and prints an error message.
Step 7: This approach helps you understand that the expected element didn’t appear as anticipated.
The script waits for something to appear on a web page; if it doesn’t show up within 10 seconds, it reports an error.
Result:
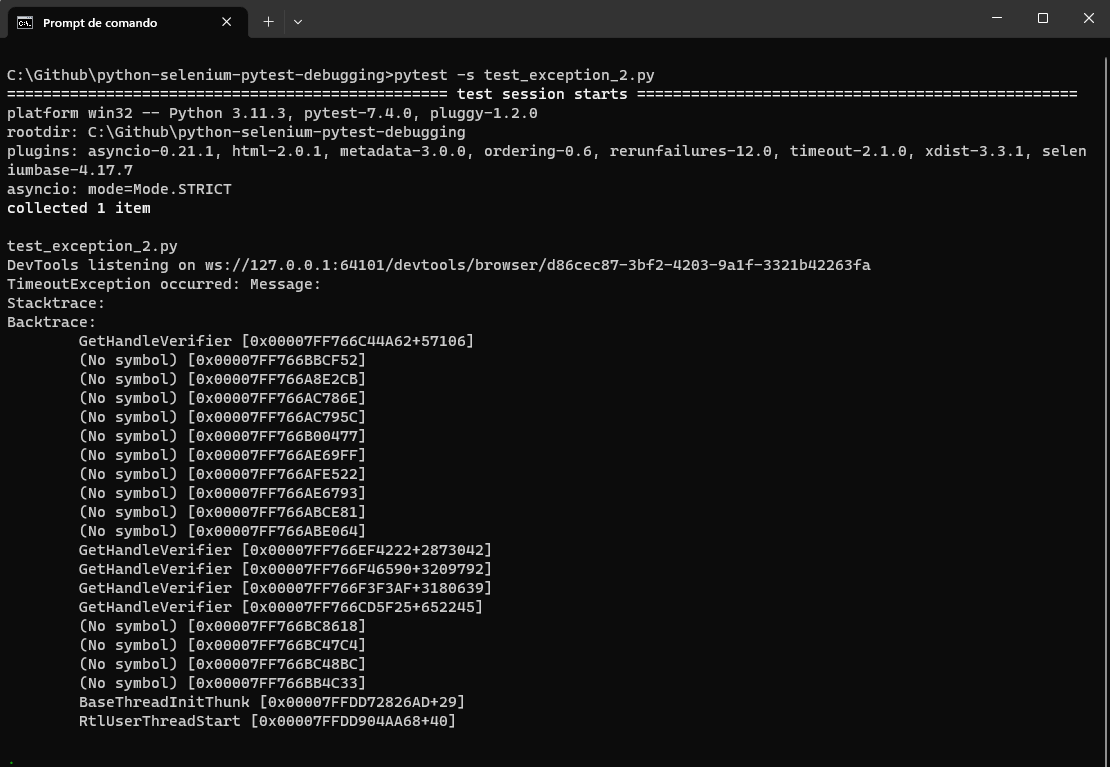
It demonstrates how the TimeoutException can occur when attempting to interact with an element that hasn’t fully loaded. It highlights the importance of proper waiting strategies to ensure synchronization between the test script and the web application.
In the further sections, we will look into more details on overcoming this synchronization issue and avoiding facing TimeoutException.
Cross-Browser Compatibility
Tests that work flawlessly on one browser may fail on another due to differences in Selenium pytest failures browser behavior. Ensuring cross-browser compatibility is essential for broader test coverage.
 Note
NoteRun tests on multiple browsers without cross-browser compatibility concerns. Try LambdaTest Today!
Environment Dependencies
Test failures in Selenium pytest failures can often be caused by external factors, such as the stability of network connectivity, the response times of servers, or the specific conditions within the test environment.
Here are a few examples of exceptions that might be encountered due to environment dependencies:
- TimeoutException: If the test script is waiting for an element to load, but the element does not load within the specified timeout, a TimeoutException can occur. It can be caused by slow server response times or network issues.
- ConnectionError: If the test script tries to establish a connection to a server or API and encounters network connectivity problems, a ConnectionError or a related exception might be raised.
- HTTPError: If the test script interacts with APIs or web services and receives unexpected HTTP responses (e.g., 404 or 500), an HTTPError might occur.
- ElementNotInteractableException: When interacting with elements on the page, if the element is not in a state where it can be interacted with (e.g., disabled, hidden), an ElementNotInteractableException can be raised. It can be related to the state of the test environment or the application itself.
- StaleElementReferenceException: If the DOM changes after an element reference has been obtained (e.g., due to dynamic content updates), attempting to interact with that element can lead to a StaleElementReferenceException.
Let us understand what TimeoutException looks like by executing some instructions.
|
1 2 3 4 5 6 7 8 9 10 11 12 13 14 15 16 17 18 19 20 21 22 23 |
from selenium import webdriver from selenium.webdriver.common.by import By from selenium.common.exceptions import ElementNotInteractableException def test_element_not_interactable_exception(): # Set up the webdriver driver = webdriver.Chrome() # Navigate to a web page with a disabled element driver.get("https://www.lambdatest.com/selenium-playground/simple-form-demo") try: # Attempt to interact with a hidden element hidden_element = driver.find_element(By.ID, "message") hidden_element.click() except ElementNotInteractableException as e: print("ElementNotInteractableException occurred:", e) finally: # Close the webdriver driver.quit() |
Before looking into its outcome, let us understand what the above code tries to perform in the following steps.
Step 1: The script navigates to a web page.
Step 2: It patiently seeks a specific element on the page, identified by its ID message.
Step 3: If this message element is in a state where interaction is impossible, perhaps because it’s hidden or disabled, it triggers an issue called ElementNotInteractableException. It occurs because the script intends to interact with the element, but it’s not in a usable state.
Step 4: To address this situation, the code includes a try block designed to catch this ElementNotInteractableException.
Step 5: If the exception occurs, the except block takes action and prints an error message.
Step 6: This approach helps you understand that the script couldn’t interact with the message element because it wasn’t in a usable state.
Result:
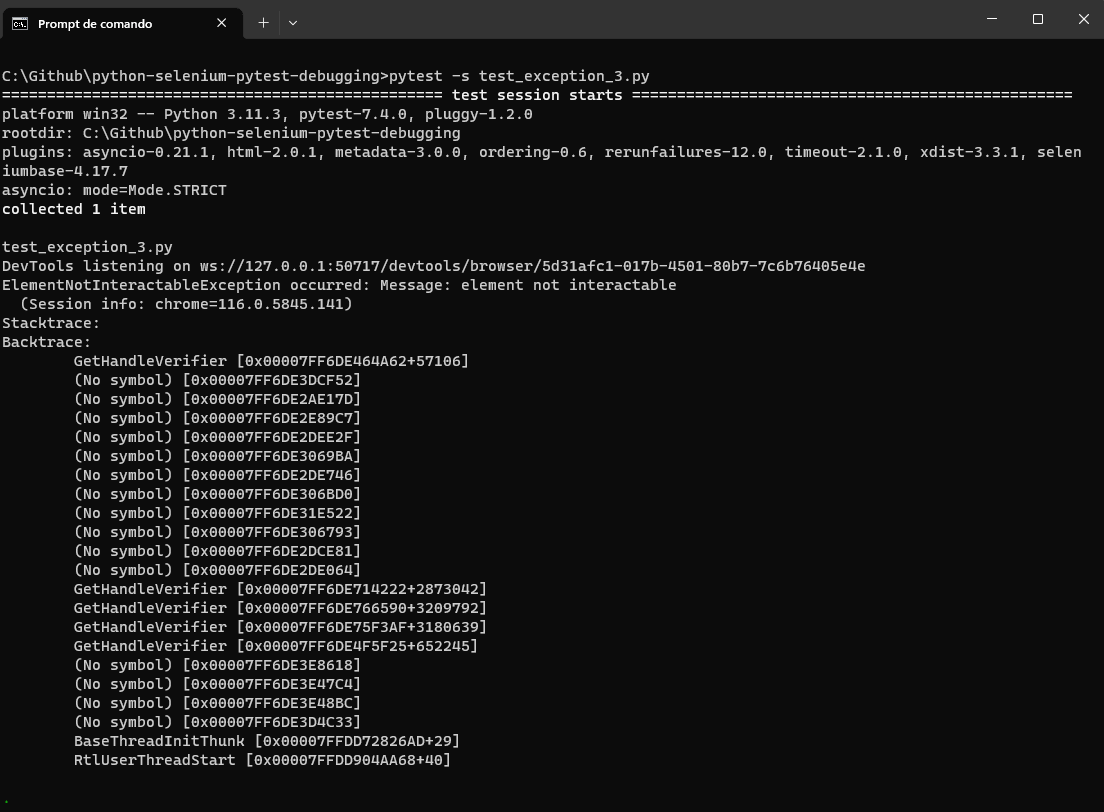
This code demonstrates how the ElementNotInteractableException can occur when attempting to interact with elements that are not in an interactable state due to the state of the test environment or the application itself.
To understand various exceptions in Selenium and how to handle them effectively, check out this blog on Selenium exceptions. It offers valuable insights and practical examples for managing various exceptions in Selenium test automation.
Having explored the everyday challenges of Selenium pytest failures, let’s dive into the debugging techniques for dealing with these issues in the following section.
Debugging Techniques for Selenium pytest Failures
Before we delve into the debugging techniques for Selenium pytest failures, we must understand that these techniques aren’t unique solutions. Each technique provides a valuable toolset, but adapting them to the unique nature of your tests and the specific issues you’re dealing with is essential.
One critical consideration is that debugging techniques for Selenium pytest failures may impact the test execution time and behavior, especially in time-bound scenarios.
With this critical context in mind, let’s explore these debugging techniques for Selenium pytest failures. They are designed to empower you to effectively address a wide range of Selenium pytest failures that may arise during your test automation journey.
Let’s look into some debugging techniques that help us overcome the challenges of Selenium pytest failures.
Debugging with Interactive Mode
Debugging interactively is a robust method developers and testers use to pinpoint and resolve code issues within Selenium pytest failures.. It provides real-time, hands-on inspection of a program’s status, variables, and how it runs, ensuring accurate issue identification and resolution.
Several interactive modes simplify debugging in Selenium pytest failures, including pausing test execution for inspection, utilizing DevTools, leveraging screenshots, and more. Let’s explore some of the most commonly used methods in Selenium pytest failures for debugging with Interactive mode.
Pausing Test Execution for Inspection
Triggering Debug Mode in Selenium pytest failures is straightforward, offering multiple entry points for inspection. Let us see common commands used in pytest.
- –pdb
- –trace
The Python Debugger (pdb) is a built-in interactive tool that offers developers a comprehensive way to diagnose, analyze, and resolve issues within Selenium pytest failures. Acting as a virtual magnifying glass, It enables programmers to pause code execution and navigate step by step through their scripts, inspect variable values, and gain a complex understanding of their code’s behavior.
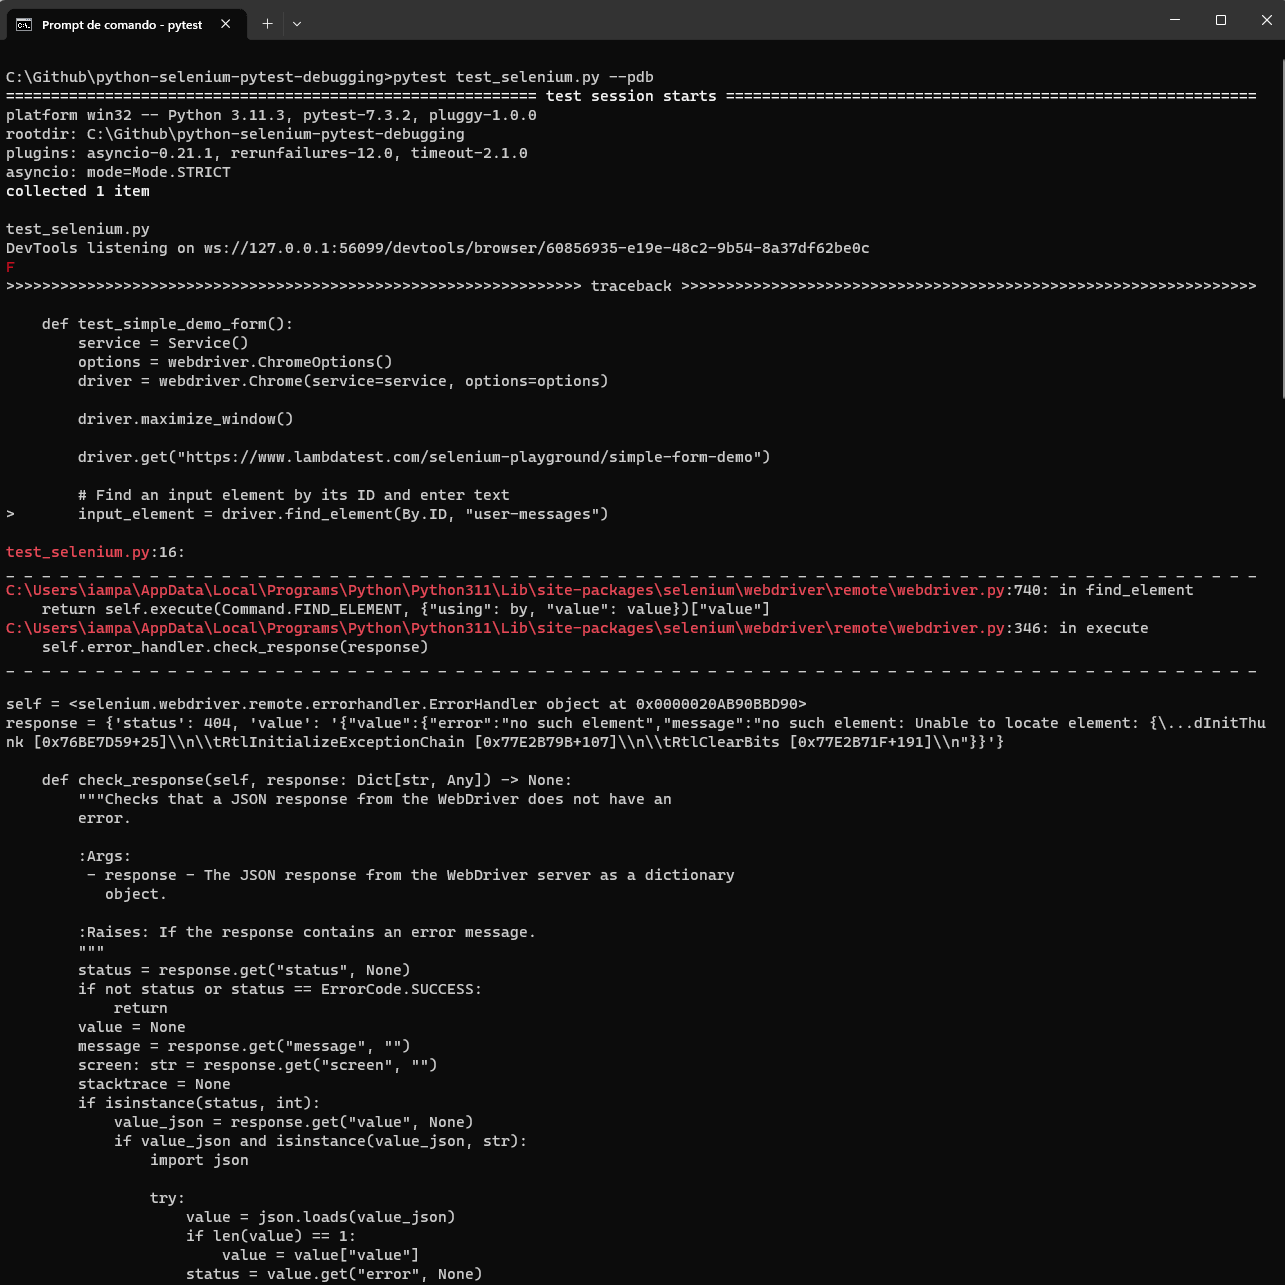
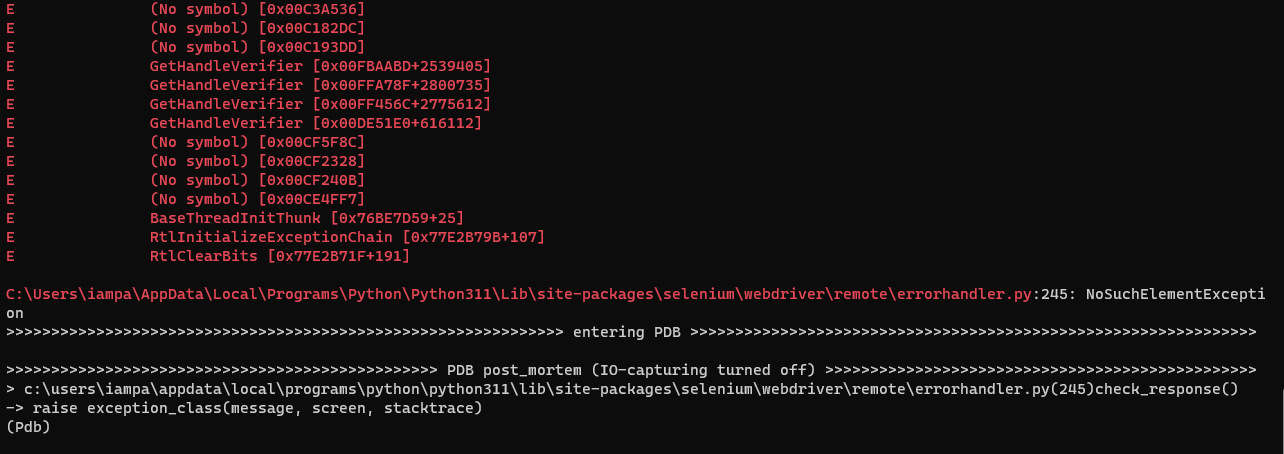
You can enter Debug Mode when a test raises in Selenium pytest failures an exception and the –pdb option is passed to pytest, providing an automatic gateway to the interactive debugger.
Let us consider the following code snippet, which opens a webpage and attempts to locate a non-existent element with the ID user-messages.
| from selenium import webdriver | |
| from selenium.webdriver.common.by import By | |
| def test_pdb(): | |
| driver = webdriver.Chrome() | |
| driver.maximize_window() | |
| driver.get("https://www.lambdatest.com/selenium-playground/simple-form-demo") | |
| input_element = driver.find_element(By.ID, "user-messages") | |
| driver.quit() | |
| # Call the test function | |
| test_pdb() |
Run the following command:
pytest test_selenium_pdb.py –pdb
Python Debugger will return all the error details.
The alternative Python Debug Mode in Selenium pytest failures is –trace, option is a command-line parameter often used in software development and debugging tools, including some testing frameworks like pytest. Let’s look into it in more detail.
–trace option is a valuable tool for developers and testers when they need in-depth insights into the execution of code or tests. It aids debugging and diagnosing issues but should be used judiciously due to its potential impact on performance.
Look at the following code, identical to the content in the file named test_selenium_pdb.py.
| from selenium import webdriver | |
| from selenium.webdriver.common.by import By | |
| def test_trace(): | |
| driver = webdriver.Chrome() | |
| driver.maximize_window() | |
| driver.get("https://www.lambdatest.com/selenium-playground/simple-form-demo") | |
| # Find an input element by its ID and enter the text | |
| input_element = driver.find_element(By.ID, "user-messages") | |
| driver.quit |
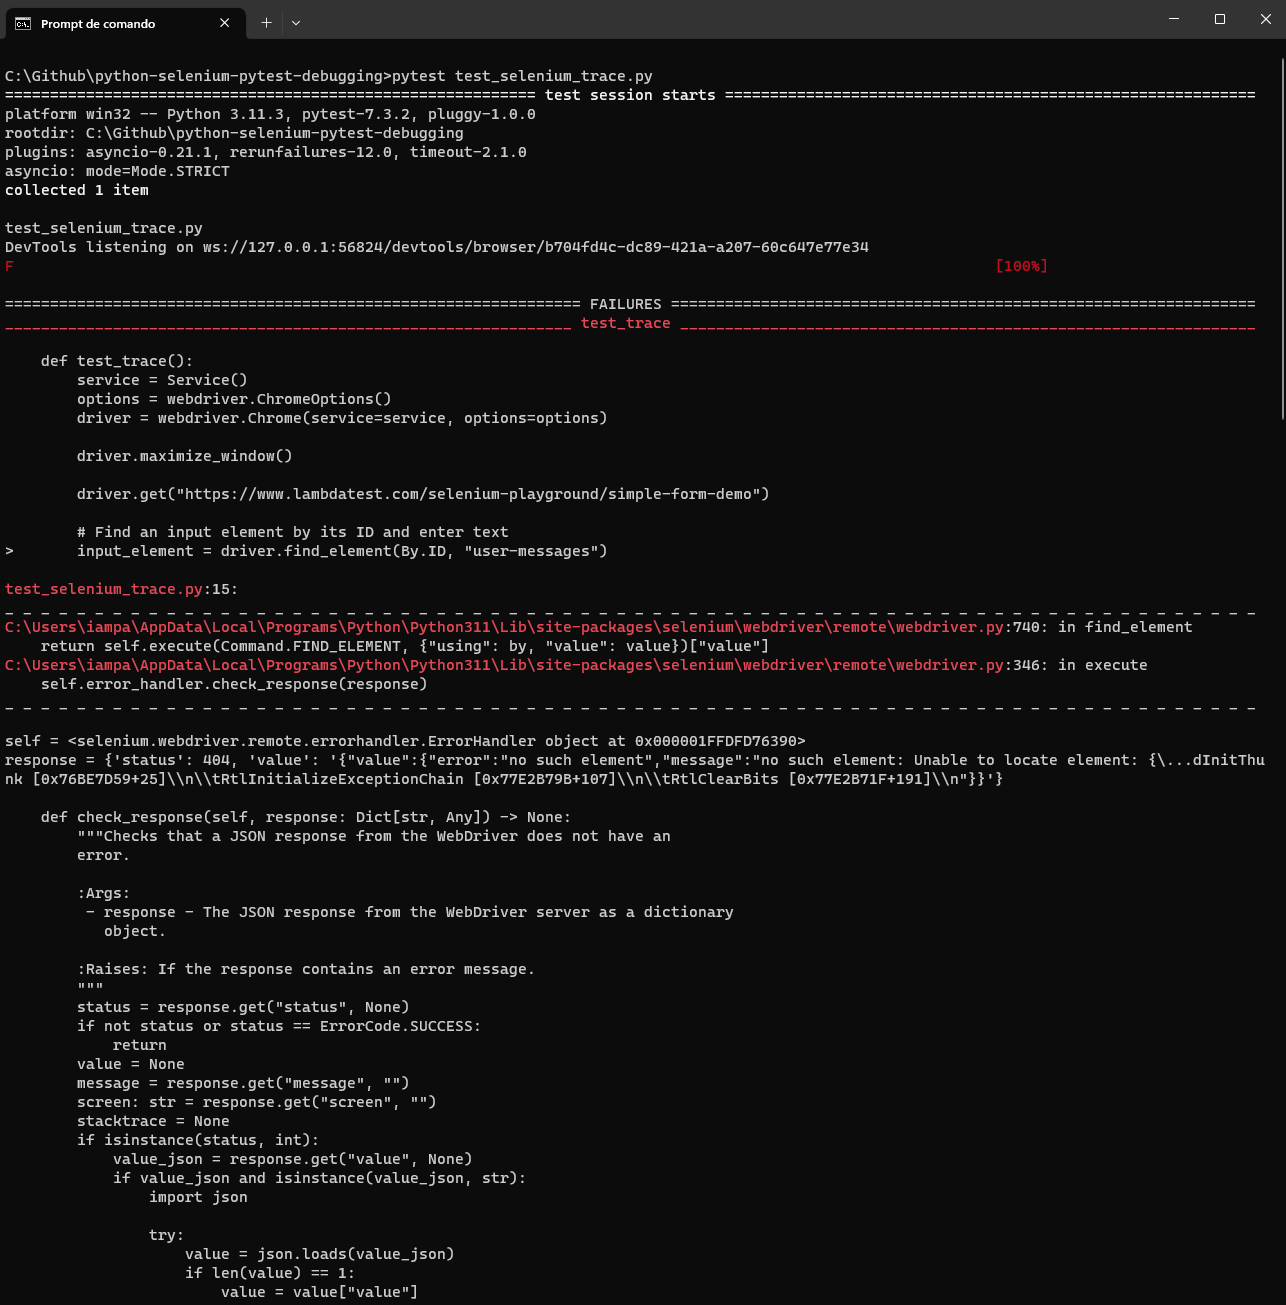
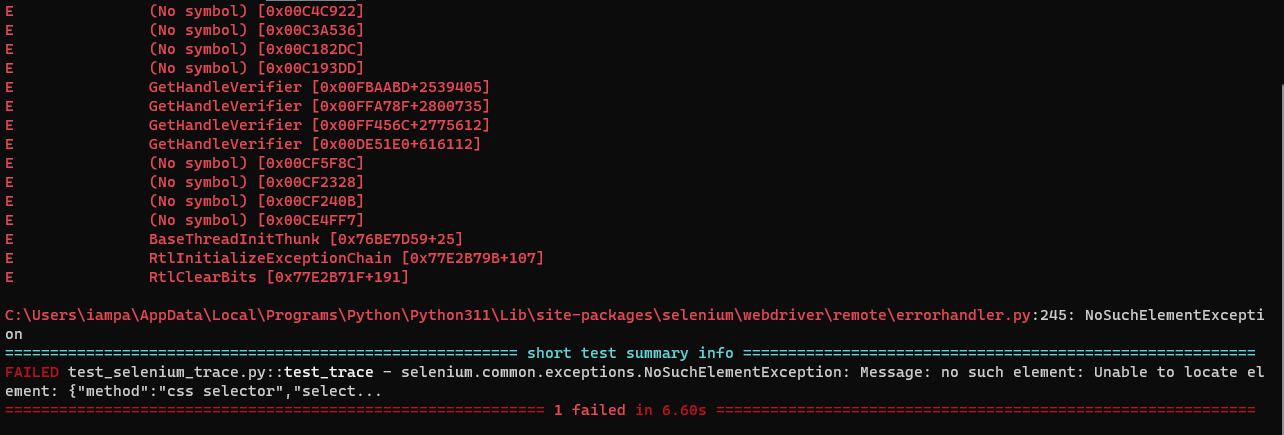
Run the following command:
pytest test_selenium_trace.py --trace
Python Debugger will return all the error details.
When you enter Debug Mode in Selenium pytest failures, you take charge of how the test runs. It gives you the ability to navigate and inspect data with precision. You’ll have access to user-friendly commands designed for smooth navigation and data examination.
| Command | Description |
|---|---|
| n (next) | This command executes the following line in the current method block, guiding you through the test's logic step by step |
| s (step) | This command allows you to traverse down the stack when the current method calls another method |
| c (continue) | This command lets you leave Debug Mode, continuing the test where the current method left off |
| j (jump) | This command enables a direct leap to the specified line number |
| w (where) | This command displays the current stack trace, guiding you through the web of method calls |
| u (up) d (down) |
These commands facilitate seamless movement up and down the stack, respectively |
| ll (longlist) | This command gives a bird's-eye view of the current method's code, granting you a comprehensive view |
| dir() | This command reveals all the namespace objects at your disposal, allowing you to inspect the available variables |
| h (help) | This command showcases all available commands at your fingertips |
With these powerful commands, Debug Mode in Selenium pytest failures transforms into a dynamic playground for comprehensive test debugging.
The suitability of using the Python Debugger (pdb) in Selenium or time-constraint-based examples depends on the specific context and objectives of the testing process.
It can be a valuable tool when test automation engineers aim to carefully diagnose and rectify issues within Selenium scripts. However, its effectiveness in time-constrained scenarios may vary, as debugging processes might introduce delays.
So, deciding whether to use pdb (Python Debugger) should be done carefully. You need to consider the advantages of detailed debugging compared to the time it might take.
Utilizing Developer Tools for Insights
Modern browsers have powerful developer tools that enable inspecting and manipulating web page elements. Use these tools, such as Chrome Developer Tools or Firefox Developer Tools, to interactively analyze the page’s structure, network requests, and JavaScript console logs.
- breakpoint()
Taking control into your own hands, you can manually summon Debug Mode in Selenium pytest failures by calling breakpoint() within your test code. Python versions 3.7+ and newer provide this method as an additional avenue to enter Debug Mode.
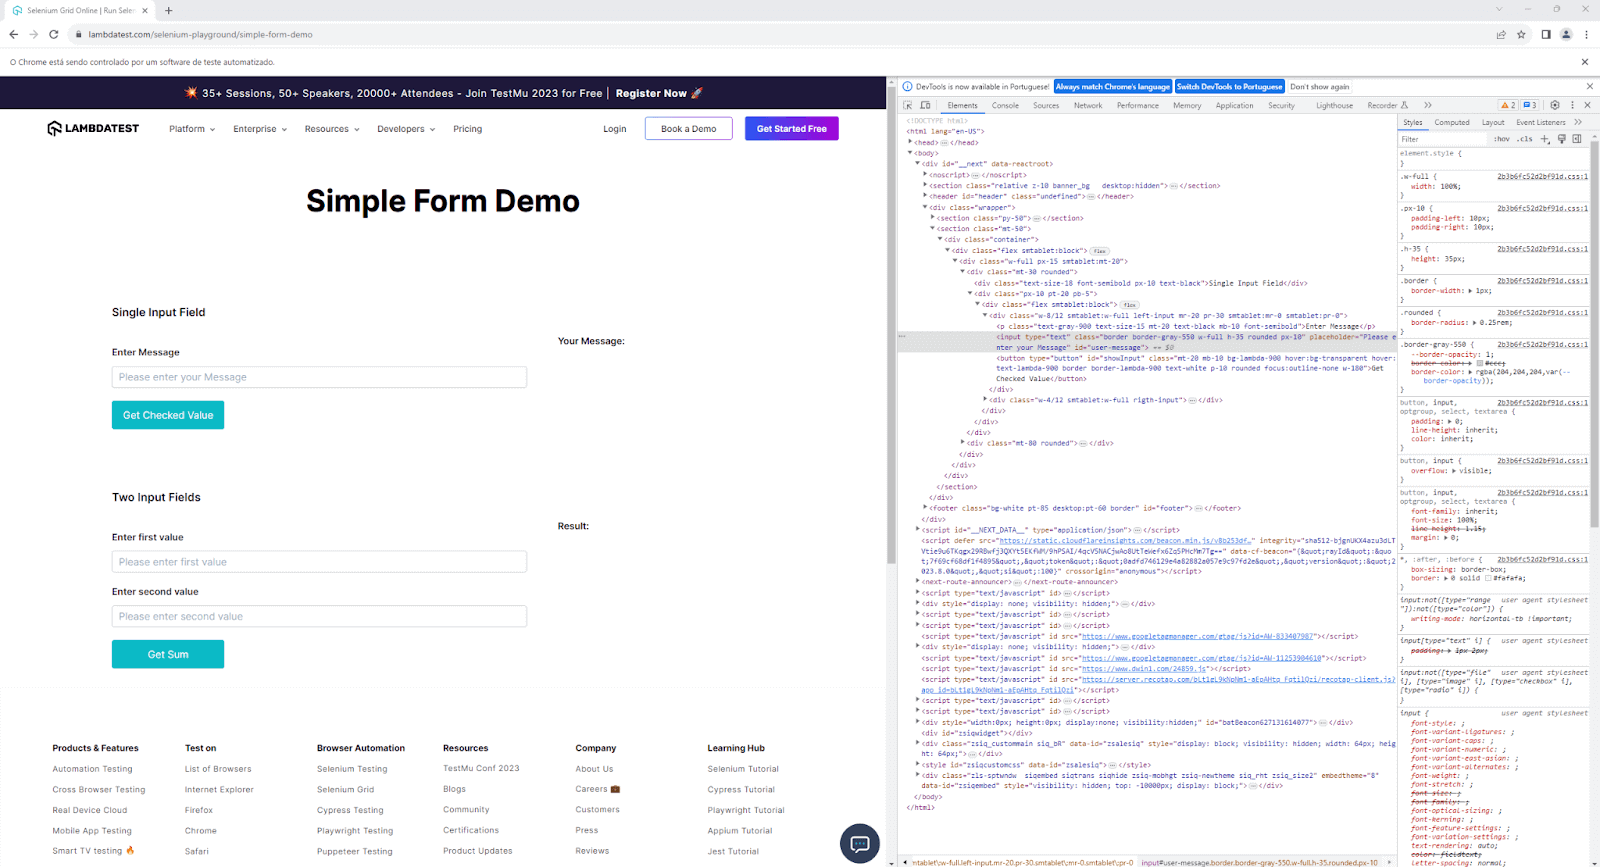
Take a look at the following code. It opens a web page and attempts to find an element with the ID user-messages, which doesn’t exist. But before trying to see it, a function called breakpoint() is invoked to help diagnose Selenium pytest failures and issues within the code.
| from selenium import webdriver | |
| from selenium.webdriver.common.by import By | |
| from selenium.webdriver.chrome.service import Service | |
| def test_breakpoint(): | |
| driver = webdriver.Chrome() | |
| driver.maximize_window() | |
| driver.get("https://www.lambdatest.com/selenium-playground/simple-form-demo") | |
| breakpoint() | |
| # Find an input element by its ID and enter text | |
| input_element = driver.find_element(By.ID, "user-messages") | |
| driver.quit |
Run the following command:
pytest test_selenium_breakpoint.py --pdb
Python Debugger will allow you to debug the code before the error happens.

Placing breakpoints at various code points helps us examine how each link on a website functions. It allows us to check the HTTP response code of each link, helping us identify and fix broken links. Learn how to use breakpoints while debugging Selenium pytest failures issues faced during development and testing. You can start with this blog on how to use breakpoints for debugging in Selenium.
Logging and Reporting
Logging and reporting in pytest are crucial aspects of test automation by implementing effective logging and reporting practices. Let us see some approaches to logging and reporting in Selenium pytest failures.
Implementing Custom Logging in pytest
Logging is essential for gaining insights into the test execution process. With custom logging in pytest, You can record relevant information, such as test steps, browser actions, and any errors encountered in Selenium pytest failures.
Let’s create a custom logging utility in a utils.py file using Python’s built-in logging module:
|
1 2 3 4 5 6 7 8 9 10 11 12 13 14 15 16 17 18 19 |
import logging def setup_custom_logger(name): # Define a log message format with date, log level, and the message itself formatter = logging.Formatter(fmt='%(asctime)s - %(levelname)s - %(message)s', datefmt='%Y-%m-%d %H:%M:%S') # Create a file handler that will write log messages to the "test.log" file handler = logging.FileHandler("test.log") handler.setFormatter(formatter) # Create a logger with the given name logger = logging.getLogger(name) logger.setLevel(logging.DEBUG) # Set the logger's level to the lowest level (DEBUG) to capture all messages logger.addHandler(handler) # Attach the file handler to the logger return logger. |
In this example, let us understand what the logging module tries to perform step-by-step.
Step 1: The setup_custom_logger function is defined to create and configure a custom logger with a specific name.
Step 2: Inside the function, a log message format is defined using the logging. Formatter class. Its format includes the date, log level, and message.
Step 3: A FileHandler is created within the function. This handler is responsible for directing log messages to a specific output, in this case, a file.
Step 4: The logging.getLogger(name) call creates a logger object with the given word. It allows the creation of multiple loggers with different names. The logger’s level is set to logging.DEBUG, the lowest level, captures all log messages regardless of severity.
Step 5: The logger is configured to write log messages to the test.log file by adding the FileHandler using the syntax logger.addHandler(handler).
Step 6: Finally, the function provides the configured logger object to log messages with the specified settings.
Now, let’s create a new file that uses the logger capability.
|
1 2 3 4 5 6 7 8 9 10 11 12 13 14 15 16 17 18 19 20 21 22 23 24 25 26 27 28 29 30 31 32 33 34 35 36 37 38 |
from utils import setup_custom_logger from selenium import webdriver from selenium.webdriver.common.by import By def test_function_that_uses_logger(): logger1 = setup_custom_logger("log1") driver = webdriver.Chrome() logger1.info("This is an informational message for logger1! Chrome driver was set!") # This will be printed driver.maximize_window() driver.get("https://www.lambdatest.com/selenium-playground/simple-form-demo") logger1.info("This is an informational message for logger1! Chrome windows was maximized and url was opened!") # This will be printed try: logger1.warning("This is a warning message for logger1! Next line will try to locate an element and can generate an error!") # This will be printed input_element = driver.find_element(By.ID, "user-messages") except: logger1.error("This is an error message for logger1! Element was not found!") # This will be printed driver.quit() # Call the test function test_function_that_uses_logger() |
This code snippet demonstrates the use of the Python Selenium library for web automation and logging functionality through a custom logger in Selenium pytest failures.
Code Walkthrough:
Step 1: The code starts by importing the necessary modules: setup_custom_logger from the utils module and modules from Selenium needed for web automation.
Step 2: In the test_function_that_uses_logger function, a particular logger named logger1 is set up using a procedure called setup_custom_logger imported from the utils module.

Step 3: A new instance of the ChromeWebDriver is created using webdriver.Chrome(). This WebDriver instance will be used to interact with a web browser.
Step 4: The logger1 is used to record informational messages regarding the progress of the test. Messages such as “Chrome driver was set!” and “Chrome windows were maximized, and URL was opened!” are recorded using the logger1.info() method.

Step 5: A warning message is logged inside a try block using logger1.warning(). The code then attempts to locate an element with the ID user-messages using the find_element() method from the WebDriver. If the element is not found, an exception is raised.
Step 6: If the find_element() call raises an exception, the code within the except block executes.
Step 7: An error message is logged using logger1.error(), indicating that the element was not found. It will be thrown, given that the opened page does not have an element with the user-messages ID.
Step 8: Regardless of the outcome, the WebDriver instance is closed using the quit() method.

To run this test, just execute the below command:
| pytest test_using_logger.py |
The output will be written to the test.log file with the timestamp, log level, and log message for each log entry. Depending on the logger’s level and log messages’ severity, different messages will be included in the log file.

Capturing Screenshots
By incorporating screenshot capture during test execution, testers can unveil valuable insights into Selenium pytest failures and the application’s state at the precise moment of test failure. With its embedded capabilities, Selenium empowers us to seamlessly capture screenshots, turning visual cues into a powerful debugging tool.
Selenium offers a dynamic range of options for capturing screenshots, catering to diverse debugging needs.
- Capture Full-Page Element Screenshots
- Capture Specific Element Screenshots
- Implicit Waits
- Explicit Waits
- Locate the IFrame Element
- Switch to the IFrame
- Interact with Elements
- Switch Back to the Main Context
- Capture Window Handles
- Switch to a New Window
- Interact with Elements
- Switch Back to the Main Window
- Minimize Test Dependencies: Avoid relying on external factors, such as APIs or services, that may introduce variability.
- Use Explicit Data: Use explicit test data instead of randomly generated data, ensuring consistent input values for each test run.
- Setup and Teardown: Ensure proper setup and teardown of test data and environment before and after each test.
Selenium’s save_screenshot() method allows us to capture the complete visible area of the web page, rendering a comprehensive snapshot of the application’s appearance and layout at the moment of test failure. It proves invaluable for identifying layout discrepancies or unexpected content placements.
The code snippet below demonstrates how to capture an entire page screenshot:
|
1 2 3 4 5 6 7 8 9 10 11 12 13 14 15 16 17 18 19 20 21 22 |
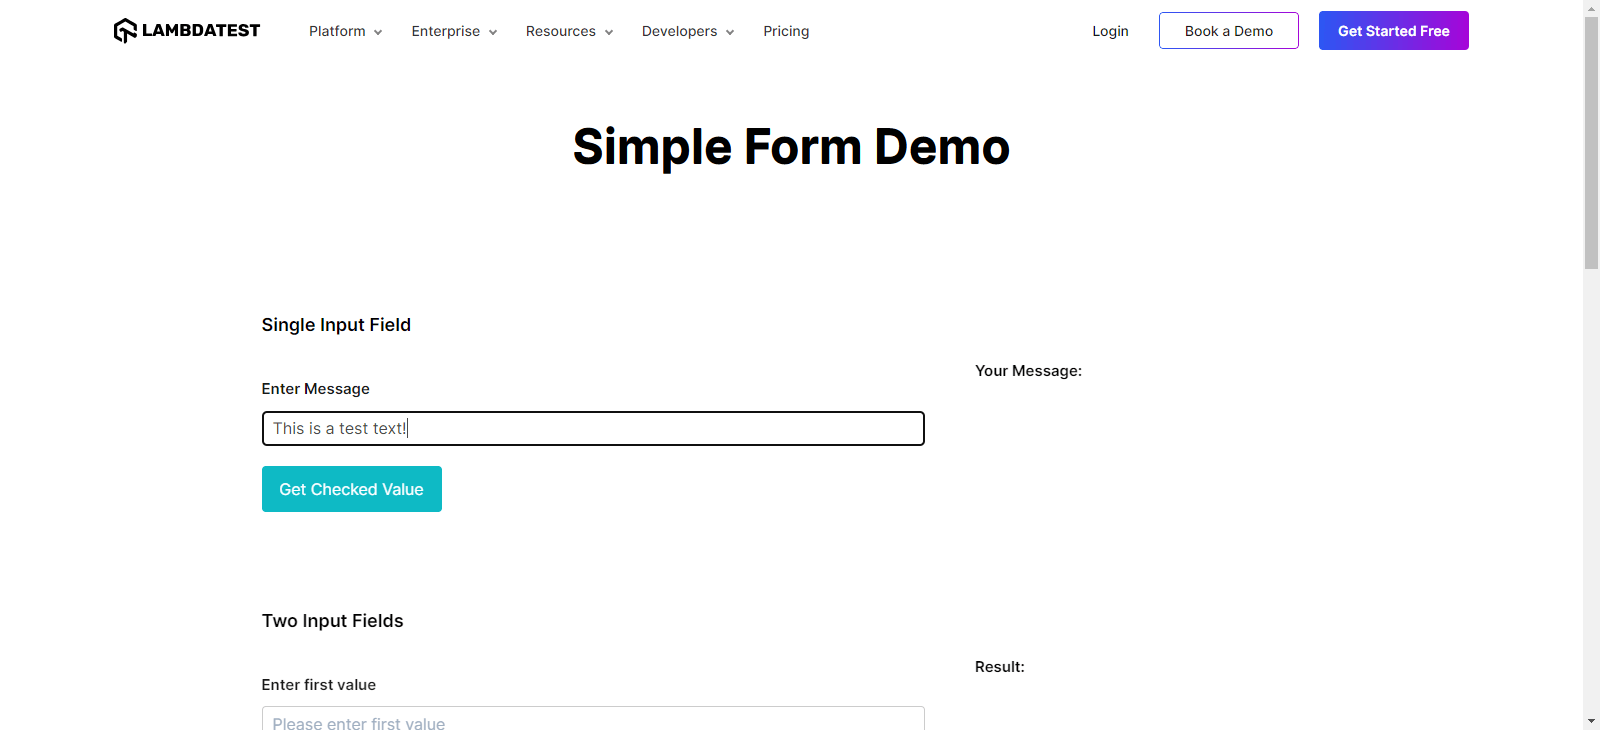
from selenium import webdriver from selenium.webdriver.common.by import By def test_screenshot_1(): driver = webdriver.Chrome() driver.maximize_window() driver.get("https://www.lambdatest.com/selenium-playground/simple-form-demo") input_element = driver.find_element(By.ID, "user-message") input_element.send_keys("This is a test text!") driver.save_screenshot('screenshots/fullpage.png') driver.quit() |
When running this code, you will get the below result:

In the screenshots folder, you will have this fullpage.png file, which will consist of the UI details of the test that we just ran.
Often, the key to unraveling Selenium pytest failure lies in the details. Selenium enables us to capture screenshots of specific elements using the screenshot() method, focusing on minute areas of interest within the page. This is particularly useful for highlighting elements not properly interacted with or unexpected behavior within isolated regions of the application.
The code snippet below showcases how to capture a screenshot of a specific element:
|
1 2 3 4 5 6 7 8 9 10 11 12 13 14 15 16 17 18 19 20 21 22 |
from selenium import webdriver from selenium.webdriver.common.by import By def test_screenshot_2(): driver = webdriver.Chrome() driver.maximize_window() driver.get("https://www.lambdatest.com/selenium-playground/simple-form-demo") input_element = driver.find_element(By.ID, "user-message") input_element.send_keys("This is a test text!") input_element.screenshot('screenshots/element.png') driver.quit() |
When running this code, you will get the below result:

In the screenshots folder, you will have this element.png file:
![]()
The visual information encapsulated within these screenshots can expedite the Selenium pytest failure debugging process by providing tangible evidence of the application’s state during test failure. During analysis, keep an eye out for irregularities such as unexpected elements, anomalies in the page layout, or elements that haven’t been interacted with as intended.
These screenshots do more than just help with debugging; they enable visual testing, automatically comparing screenshots from different test runs to find tiny visual differences. This doesn’t just improve test accuracy; it also enhances how your application looks.
When you add screenshot capture to your Selenium tests, it doesn’t just speed up debugging; it helps you understand why things went wrong. Think of it as a visual journey that makes debugging smarter and more efficient.
Want to learn more about how smart visual testing can save time and make your application look good? Watch this entire guide on smart visual testing and enhance your testing skills.
Types of Selenium pytest failures
When using Selenium pytest failures for web automation, tests can encounter several failures during execution. Let us explore some failures in detail.
Element Identification Failures
Element identification is a fundamental aspect of automation. When elements cannot be located, it leads to test failures. Common methods for locating elements include
| Aspect | Definition |
|---|---|
| Locating element By ID | Using the find_element(By. ID, “element-locator”) method to locate elements based on their unique id attribute. |
| Locating element By ClassName | Using the find_element(By.CLASS_NAME, “element-locator”) method to locate elements based on their class name attribute. |
| Locating element By Xpath | Using the find_element(By.XPATH, “element-locator”) method to locate elements using XPath expressions. |
| Locating element By CSS Selector | Using the find_element(By.CSS_SELECTOR, “element-locator”) method to locate elements based on CSS selectors. |
| Locating element By Link Text or Partial Link Text | Using find_element(By.LINK_TEXT, “element-locator”) or find_element(By.PARTIAL_LINK_TEXT, “element-locator”) to locate anchor elements. |
Synchronization Issues
Synchronization issues in Selenium pytest failures occur when there is a mismatch between the test script’s execution speed and the web application’s responsiveness. To handle synchronization, use appropriate waiting strategies in Selenium, which are Implicit and Explicit waits.
Let’s learn more about each wait that can help you resolve synchronization issues for Selenium pytest failures.
Set a global wait timeout using driver.implicitly_wait() to wait for a specified time before throwing an exception if an element is not immediately available.
|
1 2 3 4 5 6 7 8 9 10 11 12 13 14 15 16 17 18 19 20 21 |
from selenium import webdriver from selenium.webdriver.common.by import By def test_implicit_wait(): # Set up the webdriver with an implicit wait driver = webdriver.Chrome() driver.implicitly_wait(10) # Wait for 10 seconds # Navigate to the web page driver.get("https://ecommerce-playground.lambdatest.io/") # Find an element using implicit wait add_to_cart_button = driver.find_element(By.ID, "addToCart") add_to_cart_button.click() # Close the webdriver driver.quit() |
Use WebDriverWait with expected_conditions to wait for specific conditions to be met before proceeding with test execution.
|
1 2 3 4 5 6 7 8 9 10 11 12 13 14 15 16 17 18 19 20 21 22 23 |
from selenium import webdriver from selenium.webdriver.common.by import By from selenium.webdriver.support.ui import WebDriverWait from selenium.webdriver.support import expected_conditions as EC def test_explicit_wait(): # Set up the webdriver driver = webdriver.Chrome() # Navigate to the web page driver.get("https://ecommerce-playground.lambdatest.io/") # Explicitly wait for the "Add to Cart" button to be clickable wait = WebDriverWait(driver, 10) add_to_cart_button = wait.until(EC.element_to_be_clickable((By.ID, "addToCart"))) add_to_cart_button.click() # Close the webdriver driver.quit() |
Selenium provides different types of waits, such as Implicit Waits, Explicit Waits, and Fluent Waits. Implicit waits set a default wait time for all elements, while explicit waits offer precise control by waiting for specific conditions when required. A combination of both waiting strategies can ensure a robust synchronization mechanism. By incorporating Selenium Waits into your test scripts, you can handle these dynamic scenarios effectively and ensure that your tests interact with web elements only when ready, reducing the chances of test failures due to timing issues.
Handling Frames and Windows
Modern web pages often utilize iframes, essentially nested iframes in HTML documents within the main document. While iframes can offer modularity and flexibility to a webpage, they require special consideration when dealing with Selenium pytest failures during automation.
Also, web applications with multiple windows or pop-ups can challenge Selenium automation. To handle such scenarios effectively and prevent Selenium pytest failures, you can use window handles to switch between different windows.
Strategies for Working with Frames
Working with frames in web automation is a common scenario, especially when dealing with complex web applications that use iframes or frames to divide the webpage into separate sections. To interact with elements within frames effectively, consider the following strategies.
Identify the iframe element on the main page using standard Selenium locator techniques like find_element(). This will give you a reference to the iframe.
Use the WebDriver’s switch_to.frame() method and pass the iframe element as an argument. This action shifts the focus of the WebDriver commands to the content of the iframe.
Once inside the iframe, you can interact with its elements just like you would with elements on the main page. Use standard locating strategies such as By.ID, By.CLASS_NAME, By.XPATH, etc.
After you’ve completed interactions within the iframe, you should switch the WebDriver’s focus back to the main context using switch_to.default_content(). This ensures that subsequent commands are executed on the main page.
Get complete insights on effectively managing iframes in Selenium by exploring our blog on handling Frames and iFrames in Selenium. This resource will give you valuable knowledge and techniques to confidently work with frames and iframes in your Selenium test automation projects.
Strategies for Managing Multiple Windows in Tests
Handling multiple windows during tests can be challenging in Selenium pytest failures. It’s essential to implement effective strategies to manage and interact with multiple browser windows accordingly. In the below points, we’ll explore various techniques to successfully deal with this aspect of Selenium pytest failures in test automation.
When a new window is opened, Selenium assigns a unique identifier, known as a window handle, to each window. You can capture these handles using the driver.window_handles property.
Use the driver.switch_to.window() method and provide the window handle of the desired window as an argument. This action directs the WebDriver’s commands to the content of the specified window.
Perform interactions within the new window using standard Selenium locator techniques.
After completing tasks in the new window, you can switch the WebDriver’s focus back to the main window using the main window’s handle. This ensures continuity in your test flow.
Learn to handle multiple windows in Selenium by watching a tutorial on how to handle multiple windows in Selenium.
This tutorial offers a practical and visual guide to help you handle window interactions in your Selenium test automation.
Effective Troubleshooting Strategies
Effective troubleshooting strategies involve systematic approaches to identify and resolve problems efficiently. In this section of the Selenium pytest failures, we will see three ways to use troubleshooting strategies.
Using pytest Features for Debugging
Here, we will learn some key features and techniques within Selenium pytest failures that can be used effectively for debugging purposes.
Temporarily Disabling Tests
During debugging, you might encounter situations where specific Selenium pytest failures need further investigation, and it’s not feasible to fix them immediately. Pytest allows you to disable tests using the @pytest.mark.skip decorator temporarily:
Disabling the test temporarily allows you to focus on other aspects of the test suite without running the problematic test.
In the below code, we have two test functions. The first one is marked with @pytest.mark.skip decorator and will be skipped. The second one will be executed.
|
1 2 3 4 5 6 7 8 9 |
import pytest # Simulated test functions @pytest.mark.skip(reason="Temporarily disabled for debugging") def test_temporarily_disabled(): print("test will be skipped") def test_simple_test(): print("test will not be skipped") |
Markers and Custom Pytest Configurations
Pytest provides powerful marker features that allow you to group and categorize Selenium pytest failures based on specific criteria. You can create custom markers to organize tests for different debugging stages.
For example, @pytest.mark.failed to mark failing tests, and @pytest.mark.slow to mark tests that spend more time on execution.
Using markers and custom pytest configurations helps you manage the debugging process effectively, ensuring that tests requiring further investigation are appropriately handled.
In the below code, we have two test functions. The first one is marked with @pytest.mark.failed decorator to flag that it is a test that fails. The second one is marked with @pytest.mark.slow decorator to flag that it is a slow test compared with others.
|
1 2 3 4 5 6 7 8 9 10 11 12 |
import pytest # Simulated test functions @pytest.mark.failed def test_failing_test(): assert 2 + 2 == 5 @pytest.mark.slow def test_slow_execution(): import time time.sleep(3) # Simulate a slow test assert True |
Interpreting Stack Traces and Error Messages
When Selenium pytest failure occurs, the stack trace provides a detailed account of the functions and method calls that led to the failure. Analyzing the stack trace can help pinpoint the exact line of code where the failure occurred. By understanding the sequence of calls, you can identify which test function or helper method triggered the error.
Additionally, stack traces often include information about the line numbers and file names, making it easier to navigate directly to the code responsible for the Selenium pytest failure.
Reproducing and Isolating Failures
Recreating and pinpointing failures is vital in software testing and debugging. When a test encounters an issue, being able to recreate the problem and identify its underlying root cause accurately is crucial for fixing it efficiently. These techniques are highly valuable whether you’re conducting manual testing or using automation testing tools like Selenium and pytest.
Let’s delve into effective methods and strategies for reproducing and pinpointing failures in software testing.
Creating Reproducible Test Cases
Reproducibility is the key to effective debugging. If you encounter a test failure, the first step is ensuring the issue can be reproduced consistently. A non-reproducible failure can be challenging to troubleshoot, as it might indicate an intermittent issue or an external factor affecting the test.
To create reproducible test cases:
Isolating Failures with Minimal Test Data
When debugging a test failure, it’s beneficial to isolate the failure by reducing the test data and steps to the minimum required to trigger the issue. This minimization process helps in identifying the specific cause of the failure without unnecessary complexity.
Utilize pytest’s test parameterization feature to create data-driven tests and isolate the failure for different input scenarios. Using parameterized tests, you can quickly isolate the failure to specific test data sets, narrowing down the root cause.
Identifying Data-Dependent Failures
Test data plays a crucial role in test automation, and failures can sometimes be attributed to incorrect or inconsistent data. When debugging, analyze the test data used during the failed test. Verify whether the test data is accurate, up-to-date, and compatible with the current application state.
To handle data-dependent failures effectively, consider using data fixtures or data factories, ensuring that test data are reliable and consistent across test runs.
Isolating Environment-Related Failures
The test environment stability is essential for reliable test execution. When encountering intermittent failures, inspect the test environment for potential issues. Check for network connectivity problems, server downtime, or third-party service disruptions.
Maintaining separate test environments for different test scenarios can help isolate environment-related failures. This way, you can identify if the issue is specific to a particular environment configuration.
For a simplified and more efficient analysis of issues and to find their root cause, you can use one of the features offered by LambdaTest HyperExecute.
LambdaTest is an AI-powered end-to-end test orchestration platform that offers HyperExecute, which is 70% faster than traditional cloud setups.
Know the concept of HyperExecute’s AI-powered Root Cause Analysis?
This feature is about detecting and understanding the reasons behind errors in your testing processes. It categorizes errors and provides a detailed overview of what’s causing them. With this tool, you can examine your test logs to quickly pinpoint why failures occur, allowing you to take prompt corrective actions.
Interested in using this feature? You can find detailed instructions in the documentation under AI-Powered Test Failure Analysis in HyperExecute.
Advanced Debugging Techniques
Debugging methods are crucial for solving complicated problems in software development and test automation. They’re more advanced than basic debugging and offer smart ways to find and fix tricky issues. These techniques are valuable for improving the quality and reliability of software.
Remote Debugging
Remote debugging is a process that allows developers to diagnose and troubleshoot software issues on a system or device that is not physically accessible. It enables debugging sessions to be conducted over a network or the internet, making it particularly useful for identifying and fixing problems on remote servers, embedded systems, or devices in different locations.
Setting Up Remote Debugging for Selenium Tests
Remote debugging allows you to inspect and interactively debug Selenium tests on a remote machine or cloud-based infrastructure. It is particularly useful when dealing with test failures that are difficult to reproduce locally.
One of the challenges in test automation is ensuring that tests are scalable and reliable, especially as the scope of testing expands. Utilizing cloud-based platforms like LambdaTest can help overcome these challenges.
By enabling concurrent test execution, LambdaTest significantly reduces testing time and enhances performance and reliability through its cloud infrastructure.
Furthermore, connecting your local development environment to the remote Selenium Grid allows for interactive test debugging on the remote infrastructure, ensuring smoother and more efficient testing processes.
Execution on Different Browsers and Platforms
Executing tests on different browsers and platforms is a crucial aspect of ensuring the compatibility and reliability of web applications. Selenium Grid facilitates this by allowing tests to be run simultaneously on various browser and platform combinations.
This multi-browser and multi-platform testing approach helps identify potential issues specific to certain browsers or operating systems, ensuring a better user experience across different environments. It enhances the overall quality and reliability of your web application, making it accessible and functional for a wider range of audience.
 Note
NoteAutomate your web testing with Selenium and pytest. Try LambdaTest Today!
Analyzing Network Traffic
Analyzing network traffic is essential for web app testing. It helps identify potential issues such as slow response times, failed requests, or unexpected data exchanges. It involves monitoring and inspecting the data exchanged between the application and the server.
Intercepting Network Requests in Selenium
Network requests play a significant role in web applications, and analyzing them can provide valuable insights into test failures. Selenium allows you to intercept network requests using browser developer tools.
For example, using Selenium with Chrome DevTools Protocol, you can intercept network events and extract relevant information such as request and response headers, status codes, and response content.
The Chrome DevTools Protocol is a comprehensive interface that enables developers to interact programmatically with the Google Chrome browser and other Chromium-based browsers. It offers a rich set of commands and events that allow for seamless automation, monitoring, and debugging of web applications.
By leveraging the Chrome DevTools Protocol, developers can access and control various aspects of browser behavior, such as inspecting and modifying the Document Object Model (DOM), simulating user interactions, capturing network activity, and assessing performance metrics.
Learn more on how you can use Chrome DevTools Protocol in Selenium 4
Subscribe to the LambdaTest YouTube channel for more videos on Real device testing and Playwright testing and to elevate your testing game!
Identifying Network-Related Failures
Analyzing network traffic can help identify issues related to API calls, AJAX requests, or server responses. For instance, if a test fails due to slow API responses, network analysis can reveal the exact request that caused the delay.
By adding network traffic analysis into your debugging process, you can understand how the application interacts with the backend and detect potential bottlenecks or failures related to network operations.
Best Practices for Preventing Selenium pytest Failures
Avoiding Selenium pytest failures to keep your test suite stable and dependable. Here are some effective best practices to minimize these failures:
Writing Robust and Maintainable Test Code
Involves creating test scripts that are strong to changes in the application under test, easy to understand, and simple to maintain.
Using Page Object Model (POM) Design Pattern
The Page Object Model (POM) is a design pattern that enhances test code maintainability by separating page-specific interactions from test scripts. Each web page or component has a corresponding page object class that encapsulates its elements and actions.
By using POM, changes to the application’s UI are localized to the page object classes, reducing the impact of UI updates on test scripts.
With POM, test scripts become more readable and easier to maintain, contributing to a more robust test suite.
Implementing Test Data Management
Effective test data management is critical for maintaining consistent and reliable test results. Avoid hardcoding test data directly into test scripts. Instead, use data fixtures or data factories to provide test data externally.
By centralizing test data management, you can easily modify test data without modifying the test scripts.
For example, you can have a test_data.json file with the below content:
|
1 2 3 4 5 |
{ "valid_user": { "username": "user123", "password": "pass456" } |
Then, you can have a test_data_fixture.py file, with this content:
|
1 2 3 4 5 6 7 8 9 10 11 12 13 |
import json # Function to load data from a fixture file def load_data_from_fixture(file_name): with open(file_name, "r") as file: return json.load(file) # Sample test using data fixture def test_using_data_fixture(): test_data = load_data_from_fixture("test_data.json") print(test_data["valid_user"]) |
The load_data_from_fixture function gets the content of a file and loads it. This function is used in test_using_data_fixture to load the content of test_data.json and then print it to the user.
This simple sample shows that concentrating the data in a separate file is good because if you need to change the data, the test case continues working without any change, you just need to change the data file.
Implementing Test Retry Mechanisms
Utilizing test retry mechanisms is a valuable approach to boosting the dependability of automated tests. It involves giving tests a second chance when they face temporary problems like network hiccups or momentary UI glitches. This helps cut down on false alarms in test failures and raises the overall reliability of your testing process.
Retrying Failed Tests Automatically
Retrying failed tests automatically is a crucial strategy for addressing intermittent test failures. These failures can arise from various factors, such as network glitches, server delays, or temporary application inconsistencies.
Manually debugging such failures can be time-consuming and inconclusive. To overcome this challenge, pytest provides a built-in @pytest.mark.flaky decorator that enables you to retry failed tests a specified number of times automatically.
Handling Intermittent Failures
Intermittent test failures can be particularly frustrating, as they might not always indicate actual defects in the application code.
By implementing a retry mechanism, you can enhance the reliability of your test suite while minimizing false negatives caused by transient issues. This approach acknowledges that test environments can be dynamic and unpredictable.
Here’s a simple example in Python showcasing how to use the @pytest.mark.flaky decorator to retry failed tests automatically:
|
1 2 3 4 5 6 7 8 9 10 11 |
import pytest import random # Simulated function with intermittent failures @pytest.mark.flaky(rerun=3) # Retry the test up to 3 times def test_intermittent_failure(): if random.randint(0, 1) == 0: assert False # Simulate a failure else: assert True |
In this example, the test_intermittent_failure() test function is marked with @pytest.mark.flaky(rerun=3), which specifies that the test should be retried up to 3 times in case of failure. The test contains random logic to simulate intermittent failures.
The assert statement either raises an assertion error (failure) or passes (success) based on the random outcome.
By using the @pytest.mark.flaky decorator, you enable pytest to automatically rerun the test a specified number of times when a failure occurs. This helps mitigate the impact of intermittent issues and increases the likelihood of successful test runs. It’s important to determine an appropriate retry count based on your specific use case and environment.
Conclusion
Mastering the art of debugging Selenium pytest failures is essential for building reliable and maintainable test automation projects. By applying various debugging techniques such as custom logging, screenshot capture, and interactive mode, you can efficiently identify and resolve issues. Additionally, implementing best practices like the Page Object Model (POM) design pattern and test data management enhances the maintainability of your test code.
Debugging is crucial in handling challenges like element identification failures, synchronization issues, and cross-browser compatibility. By using waiting strategies, handling frames and windows, and utilizing retry mechanisms, you can ensure smoother test execution.
Ultimately, the ability to effectively debug and troubleshoot test failures is paramount to the success of any test automation endeavor. By continuously refining your test suite and leveraging Python and Selenium’s capabilities, you can build a robust and trustworthy test suite that provides valuable insights into the quality of your application.
Happy debugging and successful test automation endeavors!
Frequently Asked Questions (FAQs)
How to debug pytest with breakpoint?
To debug pytest, use the –pdb flag when running your pytest command. It drops into the Python Debugger (pdb) when an error or failure occurs, allowing interactive debugging.
What is the difference between error and failure in pytest?
In pytest, an error refers to unexpected issues, like exceptions in test code, while a failure is when a test’s assertion fails, indicating an unexpected result.
Why is unittest better than pytest?
Choosing between unittest and pytest depends on your project needs. pytest offers simplicity and rich features, while unittest is part of the Python standard library and may be preferred in certain environments. Decide based on your team’s preferences and project requirements
Got Questions? Drop them on LambdaTest Community. Visit now


