Automate User Flows with Chrome DevTools Recorder: Jecelyn Yeen [Testμ 2022]
LambdaTest
Posted On: August 30, 2022
![]() 9041 Views
9041 Views
![]() 8 Min Read
8 Min Read
Jecelyn Yeen, Developer Advocate, works on Chrome DevTools at Google. We were so glad to have her on our panel of speakers at the Testμ 2022 conference. Her major focus is on the developer tooling ecosystem. She spoke about improving user experience by creating an automation test script with no code using the Chrome DevTools. Here, she explained the two initiatives the Chrome team is working on to improve the web automation experience.
The first part of the talk focused on automating user flow with Chrome DevTools recorder panel. Another initiative that the team is focusing on is to improve the cross browser testing experience. She spoke on how end-to-end testing has been a huge pain point for developers and testers.
Here is the video:

According to her, when you want to automate a user flow, for example, automating an item to the card, then it might turn out to be quite massive and encouraging since you should set up the browser correctly. You would also need to set up the environment, install libraries and focus on the different setups you need to get things done. All these are necessary to empower your team to build a new panel. The Chrome DevTools recorder panel would allow you to record, replay and measure your user flow.
Talking about the developer preview features the team is still currently working on, she demonstrated it with a page to order a coffee.
![Automate User Flows with Chrome DevTools Recorder: Jecelyn Yeen [Testμ 2022]](https://www.lambdatest.com/blog/wp-content/uploads/2022/08/Screenshot-4-1-1-1.png)
Here are the few actions that took place:
- After you click on the checkout, fill in a payment form, and submit the form, you can easily use the recorder to see if it’s already started recording.
- We can add an item to the card and click on checkout. You can then fill in a payment form and submit it.
- From the recorder, you can see that it’s currently recording.
- When you click on the cappuccino item, you can see how it captures the actions automatically.
- You can record every step when you perform these actions.
- Then, it automatically updates the selected items when the DevTools recorder records the actions.
- It would detect the best selector for you on the spot, a unique one indeed.
- Then, you can measure performance using the performance insights panel or run the user flow measure.
- Using the performance panel, you can check the page load performance and record it to check the whole user flow performance in the performance panel.
She then spoke about the top feature requests, such as needing to set a longer timeout between steps taking a long time, such as animations. Before clicking on some button or proceeding to another action, you might want to set a long time up. Previously, the recorder panel didn’t have such options, but now we have an option for a longer timeout globally for every step by default. On average, you have five minutes for the same.
She also explained how you could delete, save and share the user flow with your peers to automate the user flow. After sharing it, the user can click on the import button and select the JSON file that you have currently. When you combine the import and export features, it would be the best combo for bug reporting.
She further explained how you could perform web testing to check for performance and your real user experience by using modern devices and browsers, so after you install the extension, you can see the export as a web page. Text custom script appears on the screen, so once you export the script, you can go to the web page tab and then enable the advanced configuration sections in the script sections. You can copy and paste your exported script here and start testing. This step allows you to generate a full performance report for your websites.
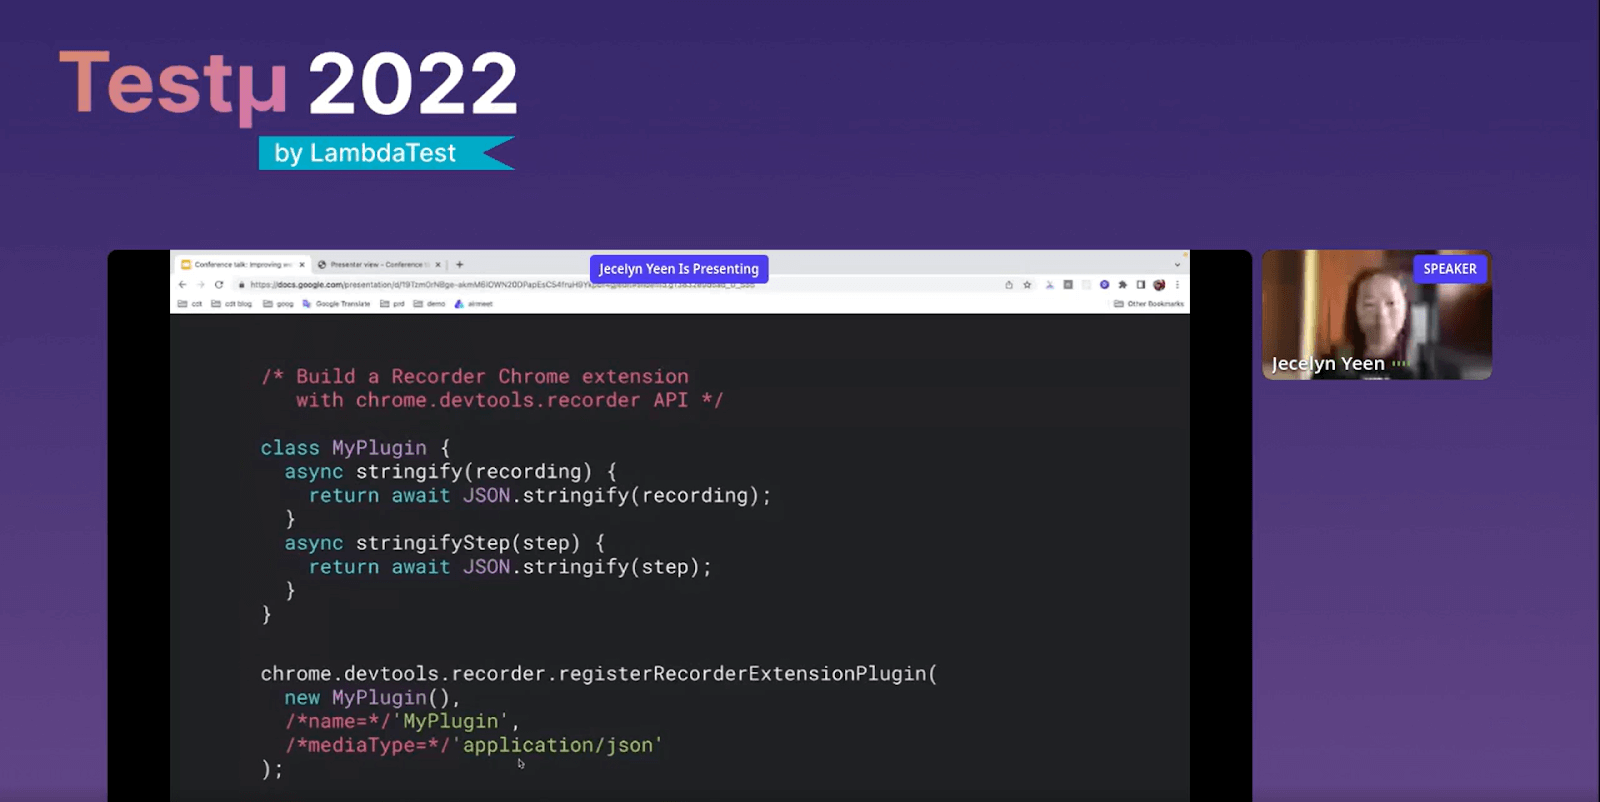
She spoke on how you can also build extensions with the open source and record. Here is the coding she provided:

Answering a few people’s questions on how you can automate the replay and the executions, she said that you might want to integrate your user flow in your CI/CD pipeline. You might have to schedule and run it daily to ensure that your end-to-end user flows run correctly. To ensure that all these processes go well, you can leverage the puppeteer replay by running npm to install Puppeteer replay. You can run the JSON user flow in bulk with the source lab to run your tests on different browser versions.
She conveyed that with all these features, Google aims to provide you with everything you need to bring down the obstacles related to end-to-end testing and make the testing journey easier.
She then moved on to talk about cross browser testing. She dropped in the details of how cross browser testing works well on a single browser but not on another one, with incorrect results. Speaking about the solution to this problem, she started on how browser automation works behind the scenes. We might start again by writing the script using certain automation libraries like Selenium, Nightwatch.js, or WebdriverIO.
The automation library will use the WebDriver protocol to talk to the WebDriver. So, each browser will release a driver for each browser release. It can be a Safari or Chrome driver. The automation library will use them and communicate using the WebDriver protocol. These web drivers will then translate our command and try to control the browsers by telling the browser what to do to execute your stat via HTTP.
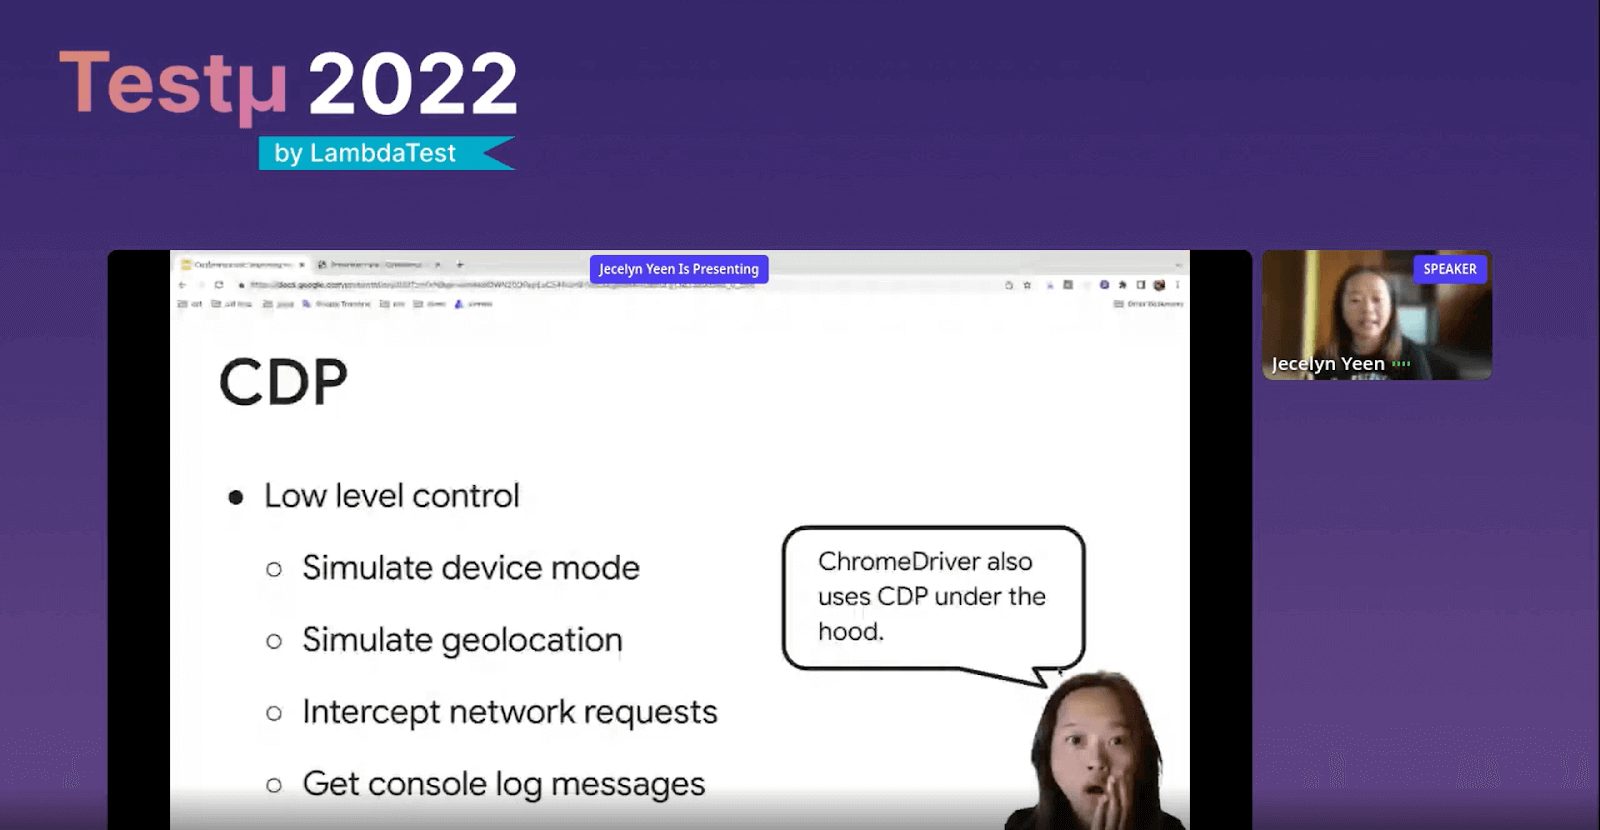
According to Jecelyn, there is another way to perform browser automation. Let’s say you are writing your Puppeteer test and want to automate the Chromium-based browser. The functionality of Puppeteer would be to translate the command to the Chrome DevTools protocol command. You can control the browsers bi-directionally through web sockets and pipes.
After explaining more about Chrome DevTools protocol, she spoke on how CDP and WebDriver have certain limitations and benefits.

She then discusses how the WebDriver offers the best browser support, whereas the API is built for testing. Hence API is easier to use, whereas CDP is only valid for Chromium-based browsers. She also narrated how the WebDriver Bi-Di project is a new standard browser automation protocol aiming to provide you with the best cross-browser support. This would also be fast because it will support bi-directional messaging and async-await features. It would offer low-level controls for fine control of your test operations and provide you with an economic API just like a WebDriver. She said that it’s still a work in progress.
She spoke on how once we create the specifications, we need steps to verify that. To ensure that happens, they depend upon an open-source set of cross-browser tests for each of the browsers. Once you set the specifications, you can check the status of each of the browsers on the WebDriver through a dashboard to see how many tests have passed, how many tests are yet to pass, and whether all the browsers are working on implementing the WebDriver protocols.
Our host, Vipul Verma, put forth a few questions by the audience to her, and she answered delightfully.
- Is there a headless feature to execute these features from the CLI or from CI/CD?
- Can I see a result report once the test run is completed?
Jecelyn: Yes! That’s what the Puppeteer replay library is for. So if you install the property replay library, you can use it because it serves as a CLI and runs it as part of your CI/CD process. You can also use the perpetual replay library for that.
Jecelyn: Unfortunately, there are currently no result reports after you execute it. From the screen, you can see that when each of the steps is a green color, it means it’s successful, and if this is not the case, it will show an error message. It doesn’t produce any report, but if you feel this feature will add value, you can send us feedback.
Vipul also shared how LambdaTest is working closely with Jecelyn Yeen on integration with the Chrome DevTools recorder. It was such a great session to remember! Hope you have found the insights shared by Jecelyn magnanimous!
After the successfull Testμ Conference 2022, where thousands of testers, QA professionals, and developers worldwide joined together to discuss on future of testing.
Join the testing revolution at LambdaTest Testμ Conference 2023. Register now!” – The testing revolution is happening, and you don’t want to be left behind. Join us at LambdaTest Testμ Conference 2023 and learn how to stay ahead of the curve. Register now and be a part of the revolution.
Got Questions? Drop them on LambdaTest Community. Visit now


